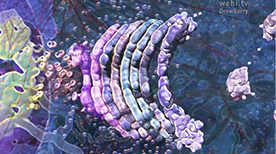
A visualization of a cell’s cytosplasm derived from electron tomography data from Brad Marsh’s laboratory. The different components – nucleus, microtubules, mitochondria, ribosomes, smooth ER, rough ER, Golgi – are highlighted in separate ‘passes’ and then overaid as one. A great reminder of how crowded cellular interiors are!