

Scientific Animator/Academic
Career Profile
Please introduce yourself (what is your current training/educational status and/or where do you work?) and share with us how you decided to get into scientific visualization.
I’m a woman of many hats: biologist, educator, illustrator, animator, visual communicator. I’m a biologist by training – I recently finished my PhD in an epigenetics lab at MIT. Midway through my PhD, I had really enjoyed my teaching experiences, and was becoming increasingly intrigued by the idea of incorporating my graphics hobby into my science career. Encouraged by people already in the science visualization field and lucky enough to find some opportunities to practice my fledgling skills, by the time I defended my thesis, I was pretty certain I wanted to deviate from the tried and true “research PhD – research postdoc – research professor” path and do something that spoke to all of my interests. I love thinking about biology, I love talking and writing about biology, but most of all, I love drawing about biology. There’s something about communicating information visually that’s just so very satisfying to my brain.
I’m phenomenally lucky in that I’ve found a position in which I can wear all of my many hats at the same time. As a Digital Learning Fellow in the MIT Department of Biology and Office of Digital Learning, I’m part of a small team that designs, creates, and manages the Department of Biology’s online educational materials. In addition to creating resources for on-campus courses, we’ve also made several free online biology courses available to a global audience. I spend much of my time creating and curating the graphics, video, and animation components of our courses, and I honestly enjoy going into work every day.
What do you like the most about this field?
I love those “Ah-hah, now I see it!” moments when I can create just the right visual to make all the pieces of a difficult concept click together in a student’s mind.
How and where did you acquire your current skillset in scientific visualization? Was it all via a graduate or other program or are you self taught? If so, did you use any particular online resources to help with your training?
I am largely self-taught. Actually, I think “self-teaching” would be a more accurate term… my learning curve doesn’t seem like it’s going to level out anytime soon! Most of my current work is 2D graphics (Adobe Illustrator) and 2D animation (Adobe After Effects), and I learn a bit more about the process with every project I do, every tutorial video I google, and everyone I collaborate with. I’ve always loved experimenting with Illustrator, and was the go-to person in graduate school for everyone with figure-making woes. I did have the opportunity to take two extremely inspiring courses with Gaël McGill on using Maya to make biological 3D animations, and one with Felice Frankel on visually communicating science, all of which had a large impact both on the way I conceptualize visualizations and on the direction of my career.
How do you feel your PhD training has an impact on your scientific visualization work? What specific skills from your PhD training have empowered you in your scientific visualization work? Do you think your PhD training has given you a unique perspective on viewing, interpreting, and creating scientific visualizations?
Some of the most useful skills I took away from my PhD are critical thinking and being able to look at a problem from many angles. Our knowledge about biology is constantly evolving, and what is “true” changes frequently… sometimes even weekly. It’s a very exciting time for biology! However, this also makes it really important to remember not to blindly trust whatever resource I’m using as a reference for my visualization, but rather to think critically and globally about the model, ask questions, and go look things up in the primary literature.
What do you consider some of the biggest barriers to entering the field? Are they technical, training, scientific, professional (availability of jobs or projects)?
The career path is anything but straightforward, and that can be intimidating to some who might be considering the field. As a biology researcher by training who wants to visually communicate biology as a profession, there’s not a “category” of job listings that fits. LinkedIn is totally confused by my profile. The way I see it, to enter the field of scientific visualization, you have to want it badly enough to take a risk and put a lot of effort and a lot of ingenuity into making your own career path – but it’s worth it! One of the silver linings is that those who have made it into this field have managed to do so because they want it. Every scientific visualization professional I’ve ever met loves what they do, and they’re thrilled to share knowledge and advice!
Which practitioners (or what visualizations) have been most inspirational to you?
So many people! David Goodsell, Drew Berry, Gaël McGill & Digizyme, Felice Frankel, Janet Iwasa, Bang Wong, Tamara Munzner, to name just a few.
Which conferences would you recommend to those interested in this field and why? What particular insights or benefits did you get out of attending this (these) conferences?
I’ve attended both VIZBI and BioVis, and found them to be two very interesting sides to the same “visualizing biology” coin. As a generalization, VIZBI is a conference of biologists passionate about making advances in visualizing data and models, while BioVis is a conference of coders and data experts passionate about using their skills to solve big problems in biology through data visualization. I’ve met so many encouraging and inspiring people at both of these conferences, and learned about what boundaries people are pushing in terms of how we can visualize biology concepts and data.
What other advice would you offer those interested in either a professional or full-time academic career in scientific visualization?
Always be on the lookout for opportunities, and be open to ones that don’t look exactly like what you had envisioned for your next career step. Meet people in the field and make an impression (a good one!) – in this field, your next job is likely to come your way via someone you know.
Please comment briefly on the samples/links that you have submitted for this profile… why in particular are you proud of these and what do you hope viewers will notice and get from seeing them?
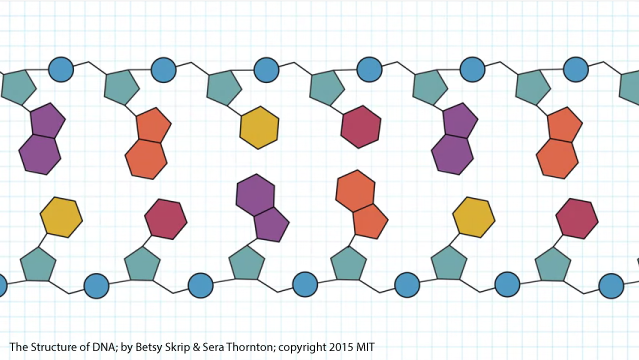
“The Structure of DNA” is a short animated educational video designed for the MITx online course 7.28.1x Molecular Biology: DNA Replication & Repair, but also meant to be able to stand alone. I made this video in collaboration with Betsy Skrip, who co-scripted and did the amazing 3D work. I’m particularly proud of this video on many levels, not least because it represents such a productive collaborative effort from which I learned so much. We leveraged the capabilities of animation to show students the relationship between the “flat” DNA they often see in textbooks and the double helix that exists in nature, and to switch smoothly between representations in order to best portray the characteristics of this molecule.
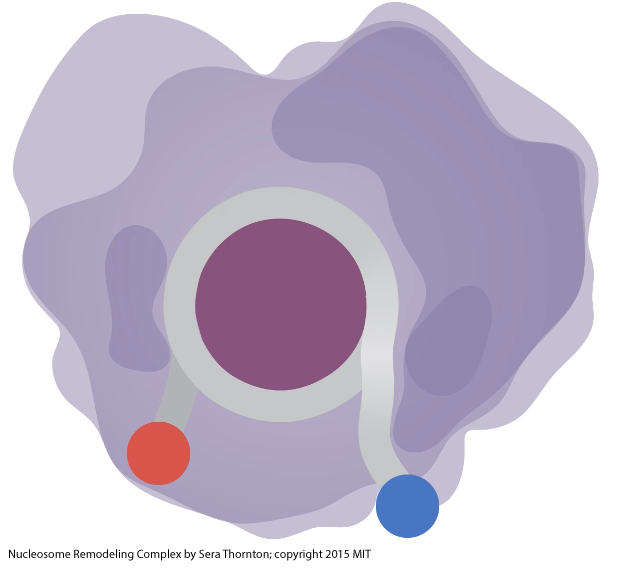
“Nucleosome Remodeling Complex” is an animated clip I created for MITx online course 7.28.2x Molecular Biology: Transcription & Transposition. You can watch it in its original lecture video context or pulled together as an un-annotated animation that can be narrated in person. I included this to represent one of my most common tasks: to start with video of a professor’s lecture, remove any images we don’t have the rights to use, and replace them with visualizations that, ideally, communicate the concept as well as or better than the originals. In this case, the original image illustrated this moving process as a series of static steps. After extensive study of this figure and the primary literature, I created this animation, and I think the result is a much more intuitive portrayal of the motion of the DNA as it is translocated.
Where do you think the field scientific visualization is ‘going’? Do you perceive any trends in its evolution or are there certain directions that you would like to see implemented?
I think it’s crucial that in the excitement of making our visualizations scientifically accurate and beautiful, we don’t neglect to check back in with the goal of each piece. Some scientific visualizations are meant to facilitate scientific discovery, while others are meant to communicate a concept, sometimes a very complex one. To progress as a field, we need to conduct rigorous research about what characteristics of our visualizations make them effective. And we need to share that evidence with each other! There is some excellent research already out there, but so much room for more studies: well-designed, well-controlled studies that are realistic about how far their results can be extrapolated. Scientific visualization is an art, but also a science.
Also: virtual and augmented reality. It’s a whole new world out there, and I’m really excited to see the new ways we use these technologies in scientific visualization.
And then lets end with a simple question… What is your ‘10 year plan’ in terms of what you hope to accomplish in scientific visualization?
My 10 year plan, eh? Well, I can’t foresee a time when I won’t want to be learning new things about the process and techniques and workflow behind creating visualizations. I hope to have conducted and still be conducting research into how to communicate visually. I hope to have amassed enough knowledge and experience that I can mentor new colleagues, much as my own mentors have. I hope to be applying this expertise and research back to biology education. And I hope to still be crafting visualizations of biology, each and every day!
Personal Website: SeraThornton.com
MITx Biology Website: web.mit.edu/mitxbio