

Science Visualization Specialist
Career Profile
Please introduce yourself (what is your current training/educational status and/or where do you work?) and share with us how you decided to get into scientific visualization.
I am the Science Visualization Specialist at MIT’s Center for Biomedical Innovation (CBI). The role includes being the Illustrator and Art Director for CBI’s online course 10.03x Making Biologic Medicines for Patients: The Principles of Biopharmaceutical Manufacturing—a 6-week online MITx course offered on edX.
I’ve known since a young age that I wanted a career that combined my passions for science and art.
What do you like the most about this field?
I love how much there is to learn and explore. Both art and science are fields that are continuously changing and growing, particularly with advancements in technology. Combine the two, along with imagination, and the possibilities are endless.
How and where did you acquire your current skillset in scientific visualization? Was it all via a graduate or other program or are you self taught? If so, did you use any particular online resources to help with your training?
I earned a BS summa cum laude in Biology with minors in Chemistry and Art from The College of New Rochelle (New Rochelle, NY) and an MFA in Medical Illustration from Rochester Institute of Technology. I also took Dr. Gaël McGill’s classes Molecular Movies: Introduction to and Advanced 3D Visualization with Maya at Harvard Medical School.
What do you consider some of the biggest barriers to entering the field? Are they technical, training, scientific, professional (availability of jobs or projects)?
Two main barriers I’ve encountered involve a need for more (1) awareness about and appreciation for the field and (2) degree programs that offer specialization from among a greater variety of scientific subjects.
Regarding awareness, on the plus side, online resources are currently much richer and more universally available than when I started out looking for ways to enter the field. Google “science visualization” today, and you will find a wealth of information, including this site! Yet, the majority of people I encounter have never heard of science visualization as an educational track or profession. From my experience, you really have to be your own advocate to help people realize potential areas for collaboration, recognize the impact professionally made visuals can have, and value the amount of training and expertise–in science, art, and communication–required to explain scientific concepts visually.
Regarding degree programs, the handful that exist all require an anatomical/surgical component. I almost didn’t attend because I do not have a strong stomach (and did almost pass out observing some of the surgeries!). I hope in the future there will exist at least one undergraduate/graduate (if not also a doctoral!) program that teaches the fundamentals of visual communication while also allowing students to specialize from a broader choice of sciences.
Which conferences would you recommend to those interested in this field and why? What particular insights or benefits did you get out of attending this (these) conferences?
So far, I have attended the Association of Medical Illustrators (AMI) annual meeting, VIZBI, and SIGGRAPH. This year, I will also be speaking at and attending my first BIOCOMM (BioCommunications Association annual meeting). Based on experience, I would highly recommend the AMI annual meeting to someone just entering or interested in the field, as the scientific visualizations and attendees’ backgrounds are very diverse, providing a large sampling of the vast opportunities possible in the field. I also highly recommend VIZBI and SIGGRAPH, though these are a bit more specialized: VIZBI focuses on the presentation of biological data, and SIGGRAPH showcases computer graphics made mainly within the entertainment industry, but including some scientific visualizations.
Please comment briefly on the samples/links that you have submitted for this profile… why in particular are you proud of these and what do you hope viewers will notice and get from seeing them?
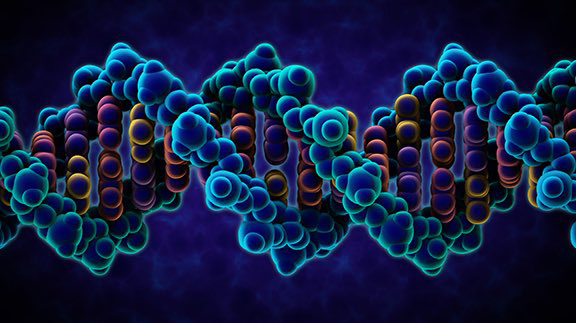
Structure of DNA was an opportunity to, together with Sera Thornton, work on all stages of animation production, from writing a script through to final compositing. We sought to depict unique and often difficult-to-visualize perspectives of DNA, such as how the commonly depicted flattened view of the helix would result from conformation of the true structure and how the major and minor grooves coil in 3D space.
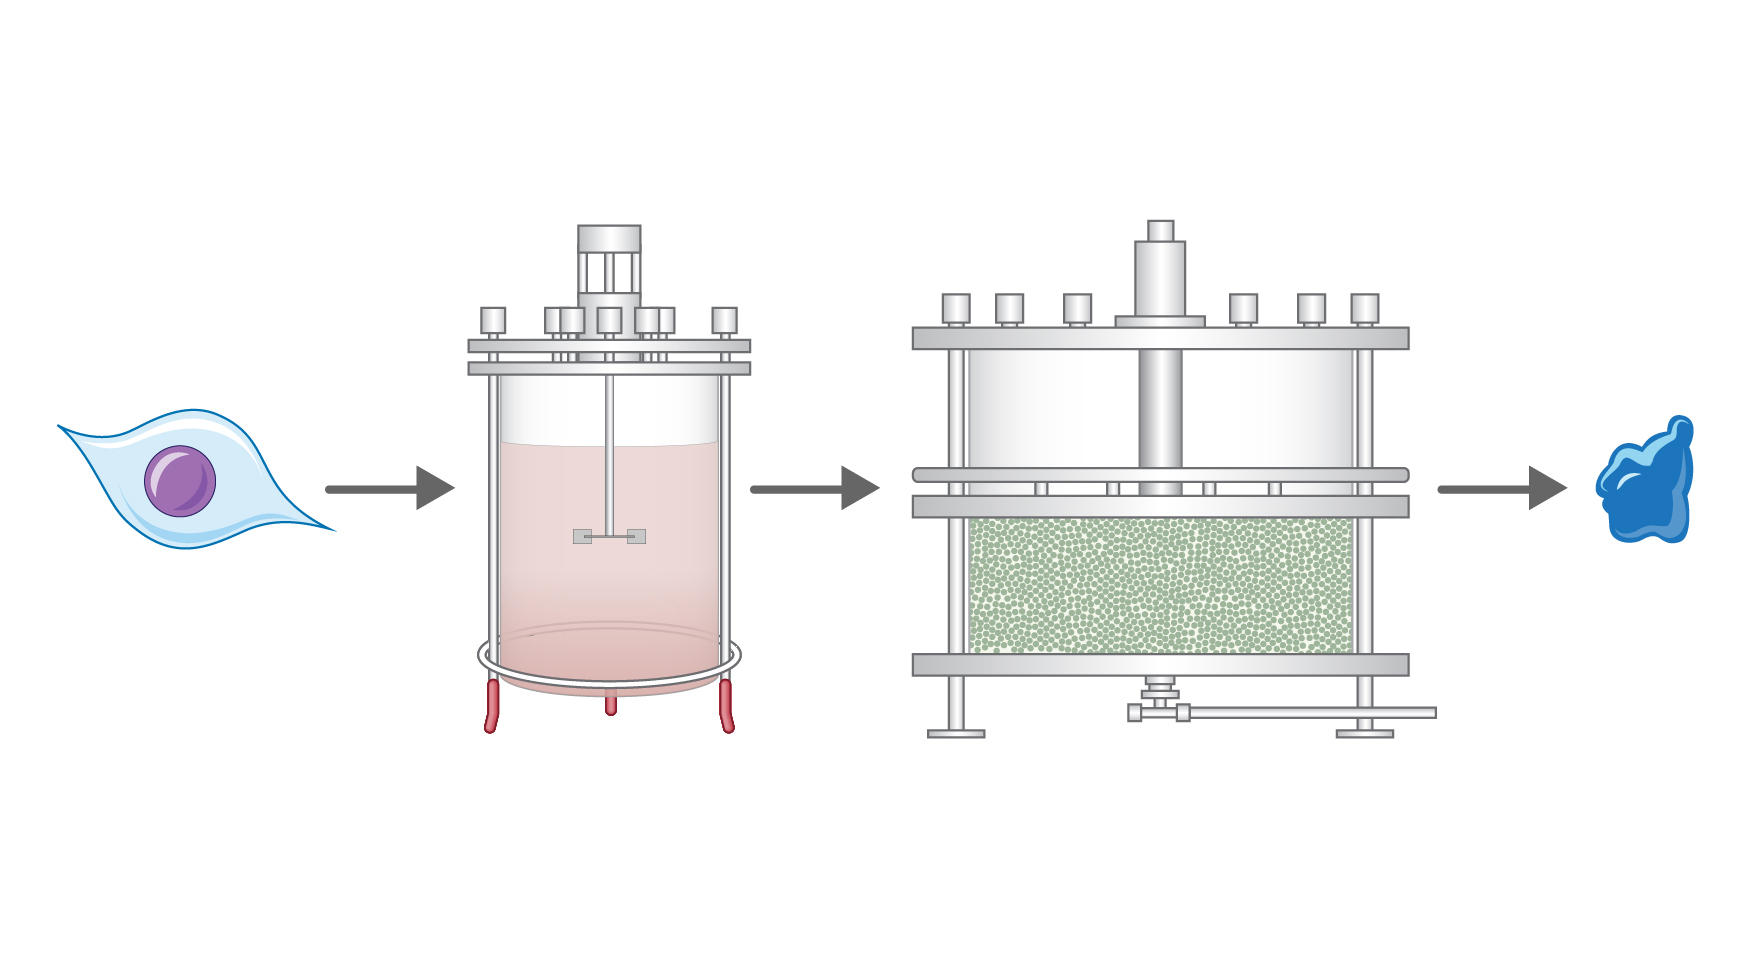
Steps in Biopharmaceutical Manufacturing is the representative graphic used to advertise 10.03x, as it iconographically shows the main stages (1) cell selection and cell line development, (2) upstream processing, and (3) downstream processing to produce (4) a target biologic. The graphic represents one of many vector illustrations I created for the nearly 60 5-minute videos that comprise the 6-week course. I highly encourage people to also check out the course’s promotional About Video to gain a better sense of the course content.
Where do you think the field scientific visualization is ‘going’? Do you perceive any trends in its evolution or are there certain directions that you would like to see implemented?
From my experience in online education, there needs to be more emphasis on instructional design, or conscious analysis and decision making about how best to present information and engage the learner. This includes proving the impact that visuals can have on learning and retention. Also, even when visuals are considered, they are often sought near the end of a project in order fit within or enhance premade material, whereas the overall learning experience can be improved by considering visuals early on. Hopefully as online education evolves, the value of professionally created science visualizations will increase, and there will be more full-time permanent science visualization positions to make up dedicated content creation teams.
And then lets end with a simple question… What is your ‘10 year plan’ in terms of what you hope to accomplish in scientific visualization?
I have ideas for several big projects that involve blending science education with entertainment. Part of my plan for accomplishing these projects involves advancing my computer graphics skills even further and researching the similarities and differences between workflows used in science visualization and the entertainment industry.
Personal Website: www.betsyskrip.com/