

Medical Illustrator
Career Profile
Please introduce yourself. What is your current training/educational status and/or where do you work? How did you decide to get into scientific visualization?
I am currently a master’s student in the Biomedical Communications at the University of Toronto. Prior to my Master’s degree I completed my doctoral degree in Medicinal Chemistry. It was during my PhD that I recognized the importance of having well-constructed visuals for the communication of my research. I started experimenting with protein visualizing software and digital painting software and from there on I was hooked. The biomedical communications program provided a wonderful opportunity to learn how to communicate science using a range of tools to many different audiences.
What do you like the most about this field?
It is extremely hard to pinpoint what I like most, but they are a couple aspects that come to mind. I really enjoy the challenge of representing the complex world of science in a manner that is accessible while maintaining scientific integrity. I like that I can use both my scientific mindset and my artistic side to produce things that help educate. Also, because a fundamental part of illustrating science is taking the time to understand it I am constantly learning new facts and concepts!
How and where did you acquire your current skillset in scientific visualization? Was it all via a graduate or other program or are you self taught? If so, did you use any particular online resources to help with your training?
I have always had an interest in the arts, but aside from a few high school courses I didn’t have any formal training leading up to the BMC program. The program represents the majority of my training in traditional media (carbon dust, pen and ink) as well as my training in visualization software like Photoshop, Illustrator, and Cinema4D. I have had to do a lot of self learning through online tutorial while constructing the online interactive educational tool needed for my Master’s research project. Resources like digital-tutors, pluralsight, lynda.com and stack-overflow.com have been really key resources for my continued training.
What do you consider some of the biggest barriers to entering the field? Are they technical, training, scientific, professional (availability of jobs or projects)?
There are several barriers to succeeding in this field, but one barrier can be found due to people’s mindset, ie. researchers failing to recognize how great an asset scientific illustrators are to the field of science. However, I think the attitude that all illustrators are good for is “pretty pictures” is changing, and many scientists are beginning to utilize visualizers for the communication of their work. I think a major aid to shifting this attitude is the existence of illustrators that have that strong scientific backgrounds. Training more scientists to be visualizers as well as instructing artists on how to be more scientific will help the reputation of our field.
How do you feel your PhD training has an impact on your scientific visualization work? What specific skills from your PhD training have empowered you in your scientific visualization work? Do you think your PhD training has given you a unique perspective on viewing, interpreting, and creating scientific visualizations?
A skill that I am constantly using is my ability to research the topics I am illustrating. I often turn to the primary literature to ensure that what I am representing is accurate. I also find that because of my scientific background I find myself closely examining the minutiae of scientific visualizations, both of my own illustrations and those of my peers. While this can be painstaking, it has helped me produce scientifically sound illustrations.
Can you provide a specific example/situation of where you think your PhD training changed the way you designed something, interacted with someone or navigated a situation?
A classmate was trying to communicate the process of signal transduction. Due to my doctoral research, I was able to correct some misconceptions that he had about the process and thereby correct his narrative and visualization. I probably went a bit too far when I sent him the portion of doctoral thesis that dealt with signal transduction.
Which practitioners (or what visualizations) have been most inspirational to you?
A major inspiration is Dr. David Goodsell, for both his academic contributions and his watercolour paintings of the crowded nature of the cell. Hearing him talk about his methodology when producing these illustrations was an eye-opening experience. Also, I find major inspiration in the extremely talented BMC faculty as well as my fellow classmates. I also find the research done by Loretta Jones and other science educators and cognitive scientists to be great for the field of scientific visualization.
Which conferences would you recommend to those interested in this field and why? What particular insights or benefits did you get out of attending this (these) conferences?
I am looking forward to attending the Gordon Research Conference Visualization in Science & Education. For someone with an interest in science and education, this conference is packed with workshops and opportunities to swap ideas between people with shared interests and diverse skills. Another excellent conference for visualizing biological information is VIZBI, a ‘must attend’ conference for people with an interest in visualizing a range of biological data.
If there was one resource, tool or conference that you could wish for to facilitate your work, what would it be?
At the BMC I have access to instructors and classmates that are all willing to share their knowledge of the different tools and techniques of our trade. While there can be no complete replacement of this resource, there currently isn’t a comprehensive repository for information/tutorials/training for our field. Having some kind of an online resource that provides information or training as well as a place to request feedback would be extremely helpful.
What other advice would you offer those interested in either a professional or full-time academic career in scientific visualization?
If you have an interest in the field, reach out and connect with people in an accredited program or check out one of the conferences mentioned above. If you are willing to do so, join one of these programs because they are incredible for teaching the skills of the trade. Also, begin producing your own illustrations, either for your own research or for colleagues to start developing as an illustrator, like anything, it is a skill that requires lots of practicing.
Please comment briefly on the samples/links that you have submitted for this profile… why in particular are you proud of these and what do you hope viewers will notice and get from seeing them?
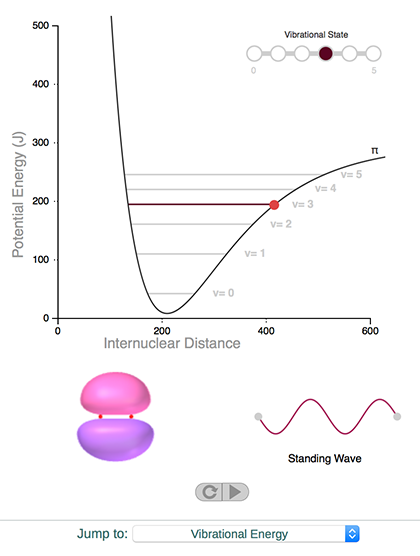
I have attached a prototype of the interactive teaching tool I am producing for my Master’s research project. The goal of this project is to provide a resource for students learning about Chemistry. It features interactive modules that feature three dimensional models and are often linked to animated graphs. Hopefully after interacting with these modules people will walk away with a better understanding of these concepts.
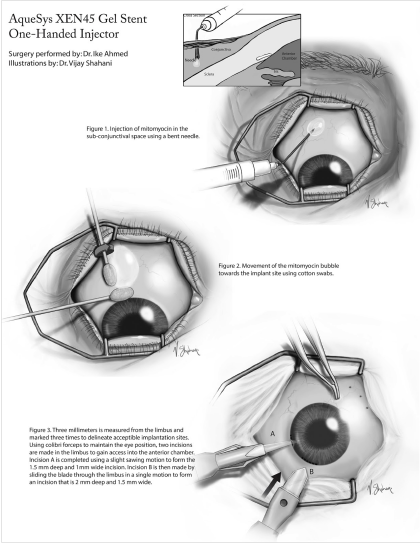
The other piece I submitted is a surgical illustration of the implantation of a micro gel stent for the treatment of glaucoma. This particular piece was an early foray into illustrator, photoshop and visual storytelling. It also highlights the incredible diversity of material that you get to experience in our field.
Where do you think the field scientific visualization is ‘going’? Do you perceive any trends in its evolution or are there certain directions that you would like to see implemented?
Given the significance of the internet in our daily lives, I can see a large push for more interactive online science visualizations produced for tools like Massive Open Online Courses (MOOCs). On a related note, the internet has made it easier to access science visualizations, but unfortunately not all these illustrations are accurate. A major push should be towards the validation of scientific visualizations, either through a review process or by publishing references together with illustrations or as part of an image’s meta-data.
And then lets end with a simple question… What is your ‘10 year plan’ in terms of what you hope to accomplish in scientific visualization?
Super simple question to end off with! I would like to get started by gaining some experience in our field. Firstly, I would like to begin by freelancing (ie. vivisci.org) by talking to researchers about visualizing their science/research. I would also pursue opportunities in producing online educational tools either independently or at a studio. My ultimate goal would be to get back into academia as a lecturer, where I can use my communication expertise to instruct others in the field of chemistry and scientific visualization. In this role, I would like to pursue research in educational sciences so that we can further optimize the visuals we create to inspire and educate.