
Scientific Illustrator
Career Profile
Please introduce yourself. What is your current training/educational status and/or where do you work? How did you decide to get into scientific visualization?
I am a Scientific Illustrator at the journal Science. I’ve always loved learning about science and making things. At the simplest level, I get very excited about figuring things out, which I believe is the core of scientific visualization. This interest, many mentors, and my BFA in Medical Illustration from Rochester Institute of Technology is what lead me into the field.
What do you like the most about this field?
There is always something new. Be it for new discoveries or new interpretations, my work allows me to delve into all types of science with the goal of extracting a narrative to communicate. It requires curiosity, creativity, and problem solving to create graphics with a teaching function. I enjoy working with and meeting other people who share the same drive. Passion is just one of the things that scientists and artists tend to have in common.
How and where did you acquire your current skillset in scientific visualization? Was it all via a graduate or other program or are you self taught? If so, did you use any particular online resources to help with your training?
Amazing teachers and mentors taught me what to take away from viewing other art, how to be critical, and how the brain perceives things. I left school knowing how to be an independent learner, which allows me to learn additional science to understand a project. It also helps with getting the most out of online resources such as Lynda, Coursera, Cineversity, Greyscalegorilla, LesterBanks, StackExchange, and the slew of nameless samaritans on forums and YouTube that help you piece together solutions.
What do you consider some of the biggest barriers to entering the field? Are they technical, training, scientific, professional (availability of jobs or projects)?
As you can see from these profiles, there is more than one way to enter this broadly defined field, so it may take some research to figure out what makes most sense for you. Another barrier is the unidentified need for well-made visuals. However, by highlighting the positive effect visual communication has on science — through papers, conferences, competitions, and communities such as Clarafi — those needs will become more obvious to individual scientists, institutions, and businesses and we should see an increased demand for talented scientific visualizers.
Which practitioners (or what visualizations) have been most inspirational to you?
There are too many to name and the list keeps growing. I try to be equally inspired by both current and historical artists and designers to find context for my own work. I enjoy studying old masters at the National Gallery of Art. Sometimes I feel that there is actually very little that has not been figured out before. You just have to look for it.
Which conferences would you recommend to those interested in this field and why? What particular insights or benefits did you get out of attending this (these) conferences?
I attend the Association of Medical Illustrator’s conference most regularly. I enjoy the AMI and its conference because there’s a great mix of experience among the members: there will be someone there who knows the answer to your question and is friendly enough to share, plus, you will find answers to questions you didn’t know you had.
What other advice would you offer those interested in either a professional or full-time academic career in scientific visualization?
This is a field that relies on mixing creativity with accuracy and precision. Being early in my own career, the advice I can offer is to embrace that fact and not be discouraged if your work doesn’t always get the reaction you expect. Always try to have an objective eye to your work.
Please comment briefly on the samples/links that you have submitted for this profile… why in particular are you proud of these and what do you hope viewers will notice and get from seeing them?
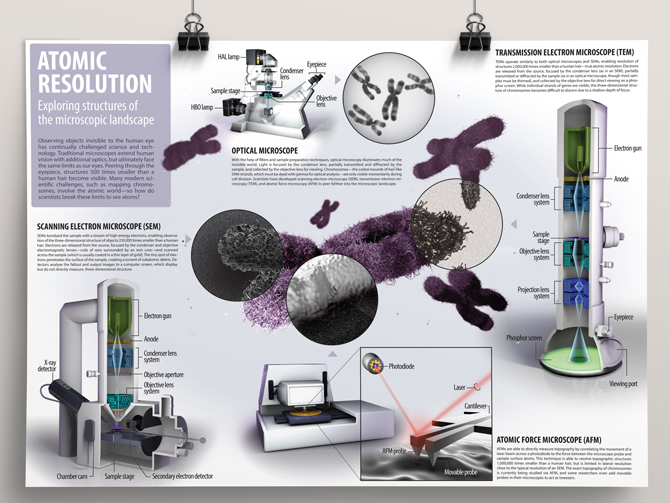
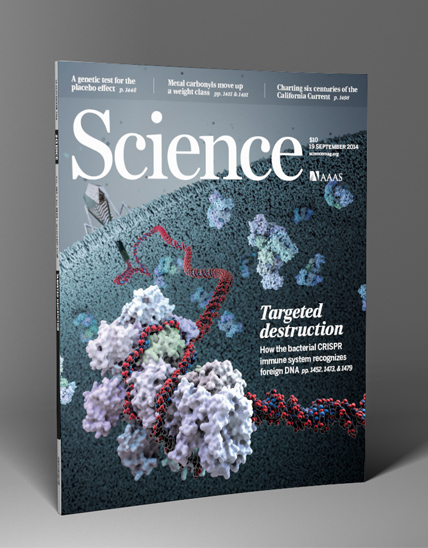
This Science cover showed the newly reported CRISPR protein complex in action with viral DNA. I chose this as an example of how illustration can breathe life into data. I am happy with how it captures the structure mid-action, bringing the viewer into the molecular world. We are able to see such things thanks to structural biologists and microscopy methods such as those shown in the Atomic Resolution poster. This infographic teaches viewers about types of microscopes, and how we use them to complete the picture of what lies beyond our sight.
Where do you think the field of scientific visualization is ‘going’? Do you perceive any trends in its evolution or are there certain directions that you would like to see implemented?
As a scientific illustrator, the pull to include data visualization in my skillset keeps getting stronger. There is a growing expectation to be able to implement real data when available, and rightfully so. This can be daunting coming from more artistic backgrounds but I think scientific illustrators should educate themselves and become comfortable working with data.
And then lets end with a simple question… What is your ‘10 year plan’ in terms of what you hope to accomplish in scientific visualization?
My hope is to keep up with new technologies and software and stay in a position to meet clients’ and colleagues’ expectations. I plan to explore how scientific illustrators can adapt to the prevalence of big data and stay afloat in an ever more complex world.
Portfolio Link: altounianillustration.com