
Medical Illustrator,
Entrepreneur
Career Profile
Please introduce yourself. What is your current training/educational status and/or where do you work? How did you decide to get into scientific visualization?
My name is Tami Tolpa, and I’m owner and principal of Tolpa Studios, Inc. where I create illustrations and animations for a variety of clients, including: science magazines, biotech companies, scientists and physicians, medical centers, and creative agencies that specialize in biomedical clients. I decided to pursue medical illustration after I had surgery in my last year of college. It motivated me to combine my artistic skills with my curiosity about medicine.
What do you like the most about this field?
Quite simply, I love learning and talking about science! I especially like communicating and collaborating with scientists. I find joy in creating visuals that support their research, describe their practices, and share their discoveries with a wider audience.
How and where did you acquire your current skillset in scientific visualization? Was it all via a graduate or other program or are you self taught? If so, did you use any particular online resources to help with your training?
I earned an MFA in medical illustration from the Rochester Institute of Technology in Rochester, NY, and immediately after, I moved to San Francisco where I acquired deeper skills through direct experience working in the field (with some great mentors). I’ve regularly attended workshops at the Association of Medical Illustrators meetings, and at times, I use lynda.com for additional software training.
What do you consider some of the biggest barriers to entering the field? Are they technical, training, scientific, professional (availability of jobs or projects)?
I’m an optimist, so I’d say that in general, there appear to be fewer barriers. But that’s not to say there aren’t some very real technical challenges. There are so many tools one can use to create scientific visualizations, it’s hard to decide which one(s) to become skilled at. And it can be difficult to learn the software in a way that applies directly to creating scientific or medical imagery. Along with these technical challenges, convincing people that this work is important can, at times, require an amount of assertiveness and tenacity that not everyone has.
Which practitioners (or what visualizations) have been most inspirational to you?
For the last several years, I’ve been inspired by the work of Martin Krzywinski at the BC Cancer Agency in Vancouver, British Columbia, and Bang Wong at the Broad Institute at MIT and Harvard in Cambridge, MA. What I love about their practice is that they’re embedded within their respective institutions, working closely with scientists, actively helping to develop a visual language for science, as well as ensuring that it’s used properly and consistently. Their visualizations are based on data, consistently beautiful, and combine the complexity of content with simplicity of style.
Which conferences would you recommend to those interested in this field and why? What particular insights or benefits did you get out of attending this (these) conferences?
Whenever I can, I attend the Association of Medical Illustrators annual meeting. Seeing the work of my peers is humbling and inspiring.
If there was one resource, tool or conference that you could wish for to facilitate your work, what would it be?
I’d love to see an event (or forum) that directly connects scientific visualizers with scientists in a way that’s mutually beneficial and synergistic, rather than in the more traditional manner in which one is supporting the learning of the other. By traditional manner I mean, for example, when a scientist lectures about science at a medical illustration conference, or a designer provides slides for a scientific conference. It’s become more apparent than ever that pictures are a very powerful means to communicate about science and to bridge the gap between knowledge and understanding. For those of us who do visualization, an opportunity to connect and work with scientists more directly would be a boon to the profession.
What other advice would you offer those interested in either a professional or full-time academic career in scientific visualization?
Be patient about breaking in, be flexible about where you find work, and be the kind of person that people want to work with.
Please comment briefly on the samples/links that you have submitted for this profile… why in particular are you proud of these and what do you hope viewers will notice and get from seeing them?
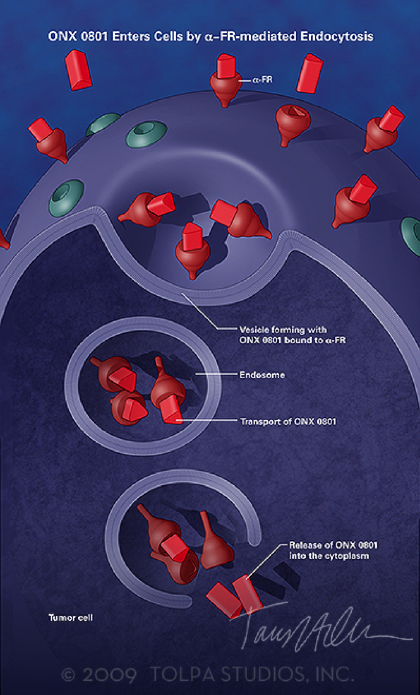
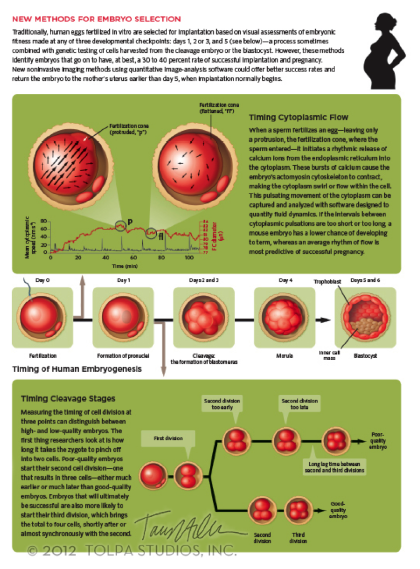
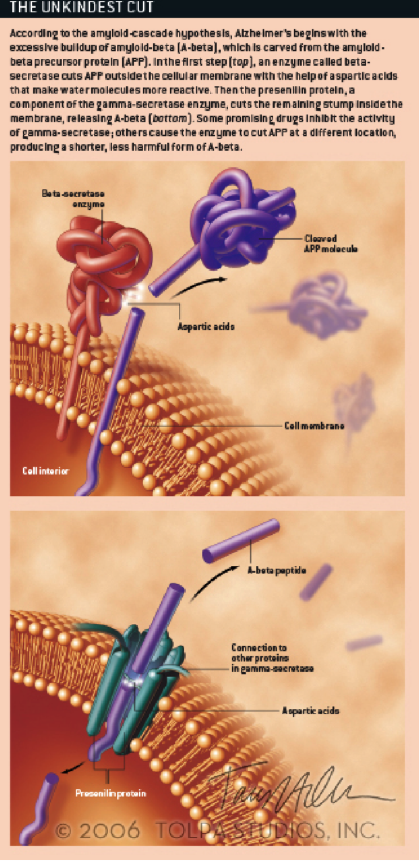
I’ve developed a style that’s both rendered and schematic. From an artistic perspective, I like the ways these three examples are both diagrammatic and dimensional at the same time. I like to use simple, 3D shapes that represent the characters in the story and I like to combine them with simple backgrounds, minimal arrows, flat enclosures, and/or data visualizations. The juxtaposition of simple with complex helps to create contrast, which appeals to our brains and eyes.
Where do you think the field scientific visualization is ‘going’? Do you perceive any trends in its evolution or are there certain directions that you would like to see implemented?
As I said before, I’d like to see visual artists work more closely with scientists as peers. I’d like the two be brought together sooner, in a collaborative relationship rather than a client-vendor relationship. The hiring of staff artists by research institutions or biotechnology companies is a trend I’ve witnessed recently that I’d like to see a lot more of.
And then lets end with a simple question… What is your ‘10 year plan’ in terms of what you hope to accomplish in scientific visualization?
I’ve really enjoyed self-employment, because it’s provided me the opportunity to work on a great variety of projects. It’s allowed me to create images for people with smaller budgets who otherwise wouldn’t have been able to afford visuals, and would’ve been resigned to using their own, less effective images.
Having said that, I’d love to work within a research institution where I’d interact more closely and more regularly with scientists, where I’d get a more intimate knowledge of the subject matter, and where I’d be helping to create a visual language for the discipline or institution. On a somewhat more courageous note, I’d also like to be creating live visuals for science presentations, the way that graphic recorders take visual notes at meetings and brainstorming sessions. I think this would be an exciting addition to science events, and an effective way to further reinforce that visuals are an extremely important tool for science communication.