
Science Visualization Specialist /
Founder of Hertig Visualizations
Career Profile
Please introduce yourself (what is your current training/educational status and/or where do you work?) and share with us how you decided to get into scientific visualization.
I create visual content for science and technology, as well as web-based interactive visualizations. After a Masters degree in physics, I did a PhD in computational biology in the group of Prof. Viola Vogel at ETH Zurich, Switzerland. Spending hours trying to make my first scientific figures for a publication look pretty, I began to realize my interest in graphics and design. I then moved to San Francisco, where I did a postdoc in the labs of Prof. Tom Ferrin (the creators of UCSF Chimera) and Graham Johnson. After a brief stint at Stanford University, I founded Hertig Visualizations in early 2016.
What do you like the most about this field?
I love to blend my passions for programming, science, and design. As a freelancer, I am in full control of my schedule. Furthermore, I hope to make a positive impact by making science more accessible to a non-specialist audience.
How and where did you acquire your current skillset in scientific visualization? Was it all via a graduate or other program or are you self taught? If so, did you use any particular online resources to help with your training?
Whereas I have been studying science and programming at universities for nearly half of my life, all my graphics skills are mostly self-acquired. The wealth of free tutorials and online resources that a simple web search can reveal is amazing. For learning new programming skills, I can recommend www.codecademy.com and the free online book “Think Python” by Allen Downey. Furthermore, I participated in a few courses on Adobe software offered by ETH Zurich, as well as an excellent scientific visualization class taught by Betsy Palay at UCSF. I also had access to a copy of “In Silico: 3D Animation and Simulation of Cell Biology with Maya and MEL” by Sharpe, Lumsden and Woolridge, when I first started learning Maya.
How do you feel your PhD training has an impact on your scientific visualization work? What specific skills from your PhD training have empowered you in your scientific visualization work? Do you think your PhD training has given you a unique perspective on viewing, interpreting, and creating scientific visualizations?
During my PhD was the first time where I picked up object-oriented programming, which is a very important skill for our field, in my opinion. Furthermore, I do benefit a lot from my broad science background. How would you be able to visualize a concept if you don’t understand it yourself? And who knows, maybe my visual cortex has received extra training in spacial/visual thinking by simply having examined a lot of 3D protein structures?
Can you provide a specific example/situation of where you think your PhD training changed the way you designed something, interacted with someone or navigated a situation?
My PhD training was the most extensive and significant training I have ever had. By that I don’t mean the specific knowledge that I gained about a certain topic, but rather how to approach scientific questions, how to conduct research, and how to disseminate scientific findings. Therefore, I don’t think that there is ever a situation where my PhD training does not influence my thinking.
What do you consider some of the biggest barriers to entering the field? Are they technical, training, scientific, professional (availability of jobs or projects)?
I was considering doing a second Master’s degree in one of the schools that offer scientific animation in the US, after my PhD. However, going back to being a student and having to pay the expensive tuition common for US schools was too big of a turn-off for me. I decided to keep learning skills on the side during my postdoc. I still think this field is very much of a niche job. How many people really get to do scientific visualization as a full-time job in academia? It might just be a handful. The current situation where funding for research other than the one that promises to cure cancer next week makes it very hard for securing grants that pay for projects aimed at developing new visualization tools or establishing outreach projects. Outside academia, there is the classic medical illustration track, where you get a Master’s degree from one of the four accredited US programs, join the AMI, etc… However, I have never really fit into that category, since my interests have always been more on a more molecular level, and more on the software-engineering/programming-heavy/interactive side. It was thus hard for me to find my place in the SciViz landscape. Currently, a big part of my contracts that pay the bills are in the realm of web programming for technical 3D-visualizations (which is very interesting to me, but would perhaps be of less interest to someone who mostly likes to create static illustrations).
Which practitioners (or what visualizations) have been most inspirational to you?
I love the work of all the pioneers in the bio-molecular animation field, especially Graham Johnson and Gaël McGill. I am also very much in awe of David Goodsell’s watercolor paintings, especially because they demonstrate that the power of an ancient drawing technique still has it’s place in the modern world. More generally, I like some of the classic graphic design principles established by Swiss designer Josef Müller-Brockmann. Lastly, I would like to mention that some concepts of Japanese aesthetics resonate with me quite strongly as well (especially Iki and Shibui).
Which conferences would you recommend to those interested in this field and why? What particular insights or benefits did you get out of attending this (these) conferences?
I attended the VizBi conference in 2012 and 2015 and still benefit from the connections with some great people whom I met there.
If there was one resource, tool or conference that you could wish for to facilitate your work, what would it be?
A conference that unites the fields of data visualization and scientific visualization.
What other advice would you offer those interested in either a professional or full-time academic career in scientific visualization?
Focus on your portfolio as well as your personal connections and professional network. Learn how to program, especially in JavaScript and Python. Become an expert in using a vector-based drawing software like Adobe Illustrator or Inkscape. Don’t limit yourself to a specific scientific field.
Please comment briefly on the samples/links that you have submitted for this profile… why in particular are you proud of these and what do you hope viewers will notice and get from seeing them?
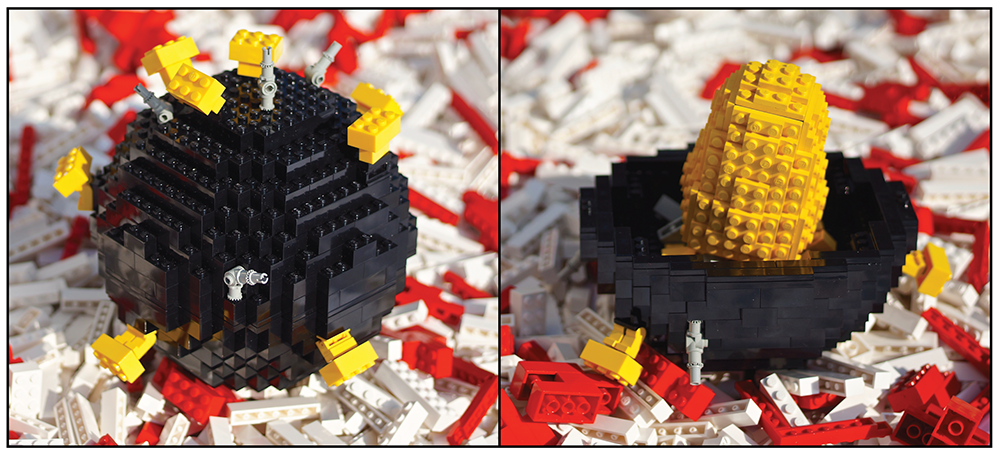
Sample 1: Lego-HIV movie
I created it for a SciViz challenge in 2013. It received an honorary mention from the jury, and it was the only video in the competition that wasn’t created with 3D-animation software. You can see the movie here: https://youtu.be/1WZHoy16Yww.
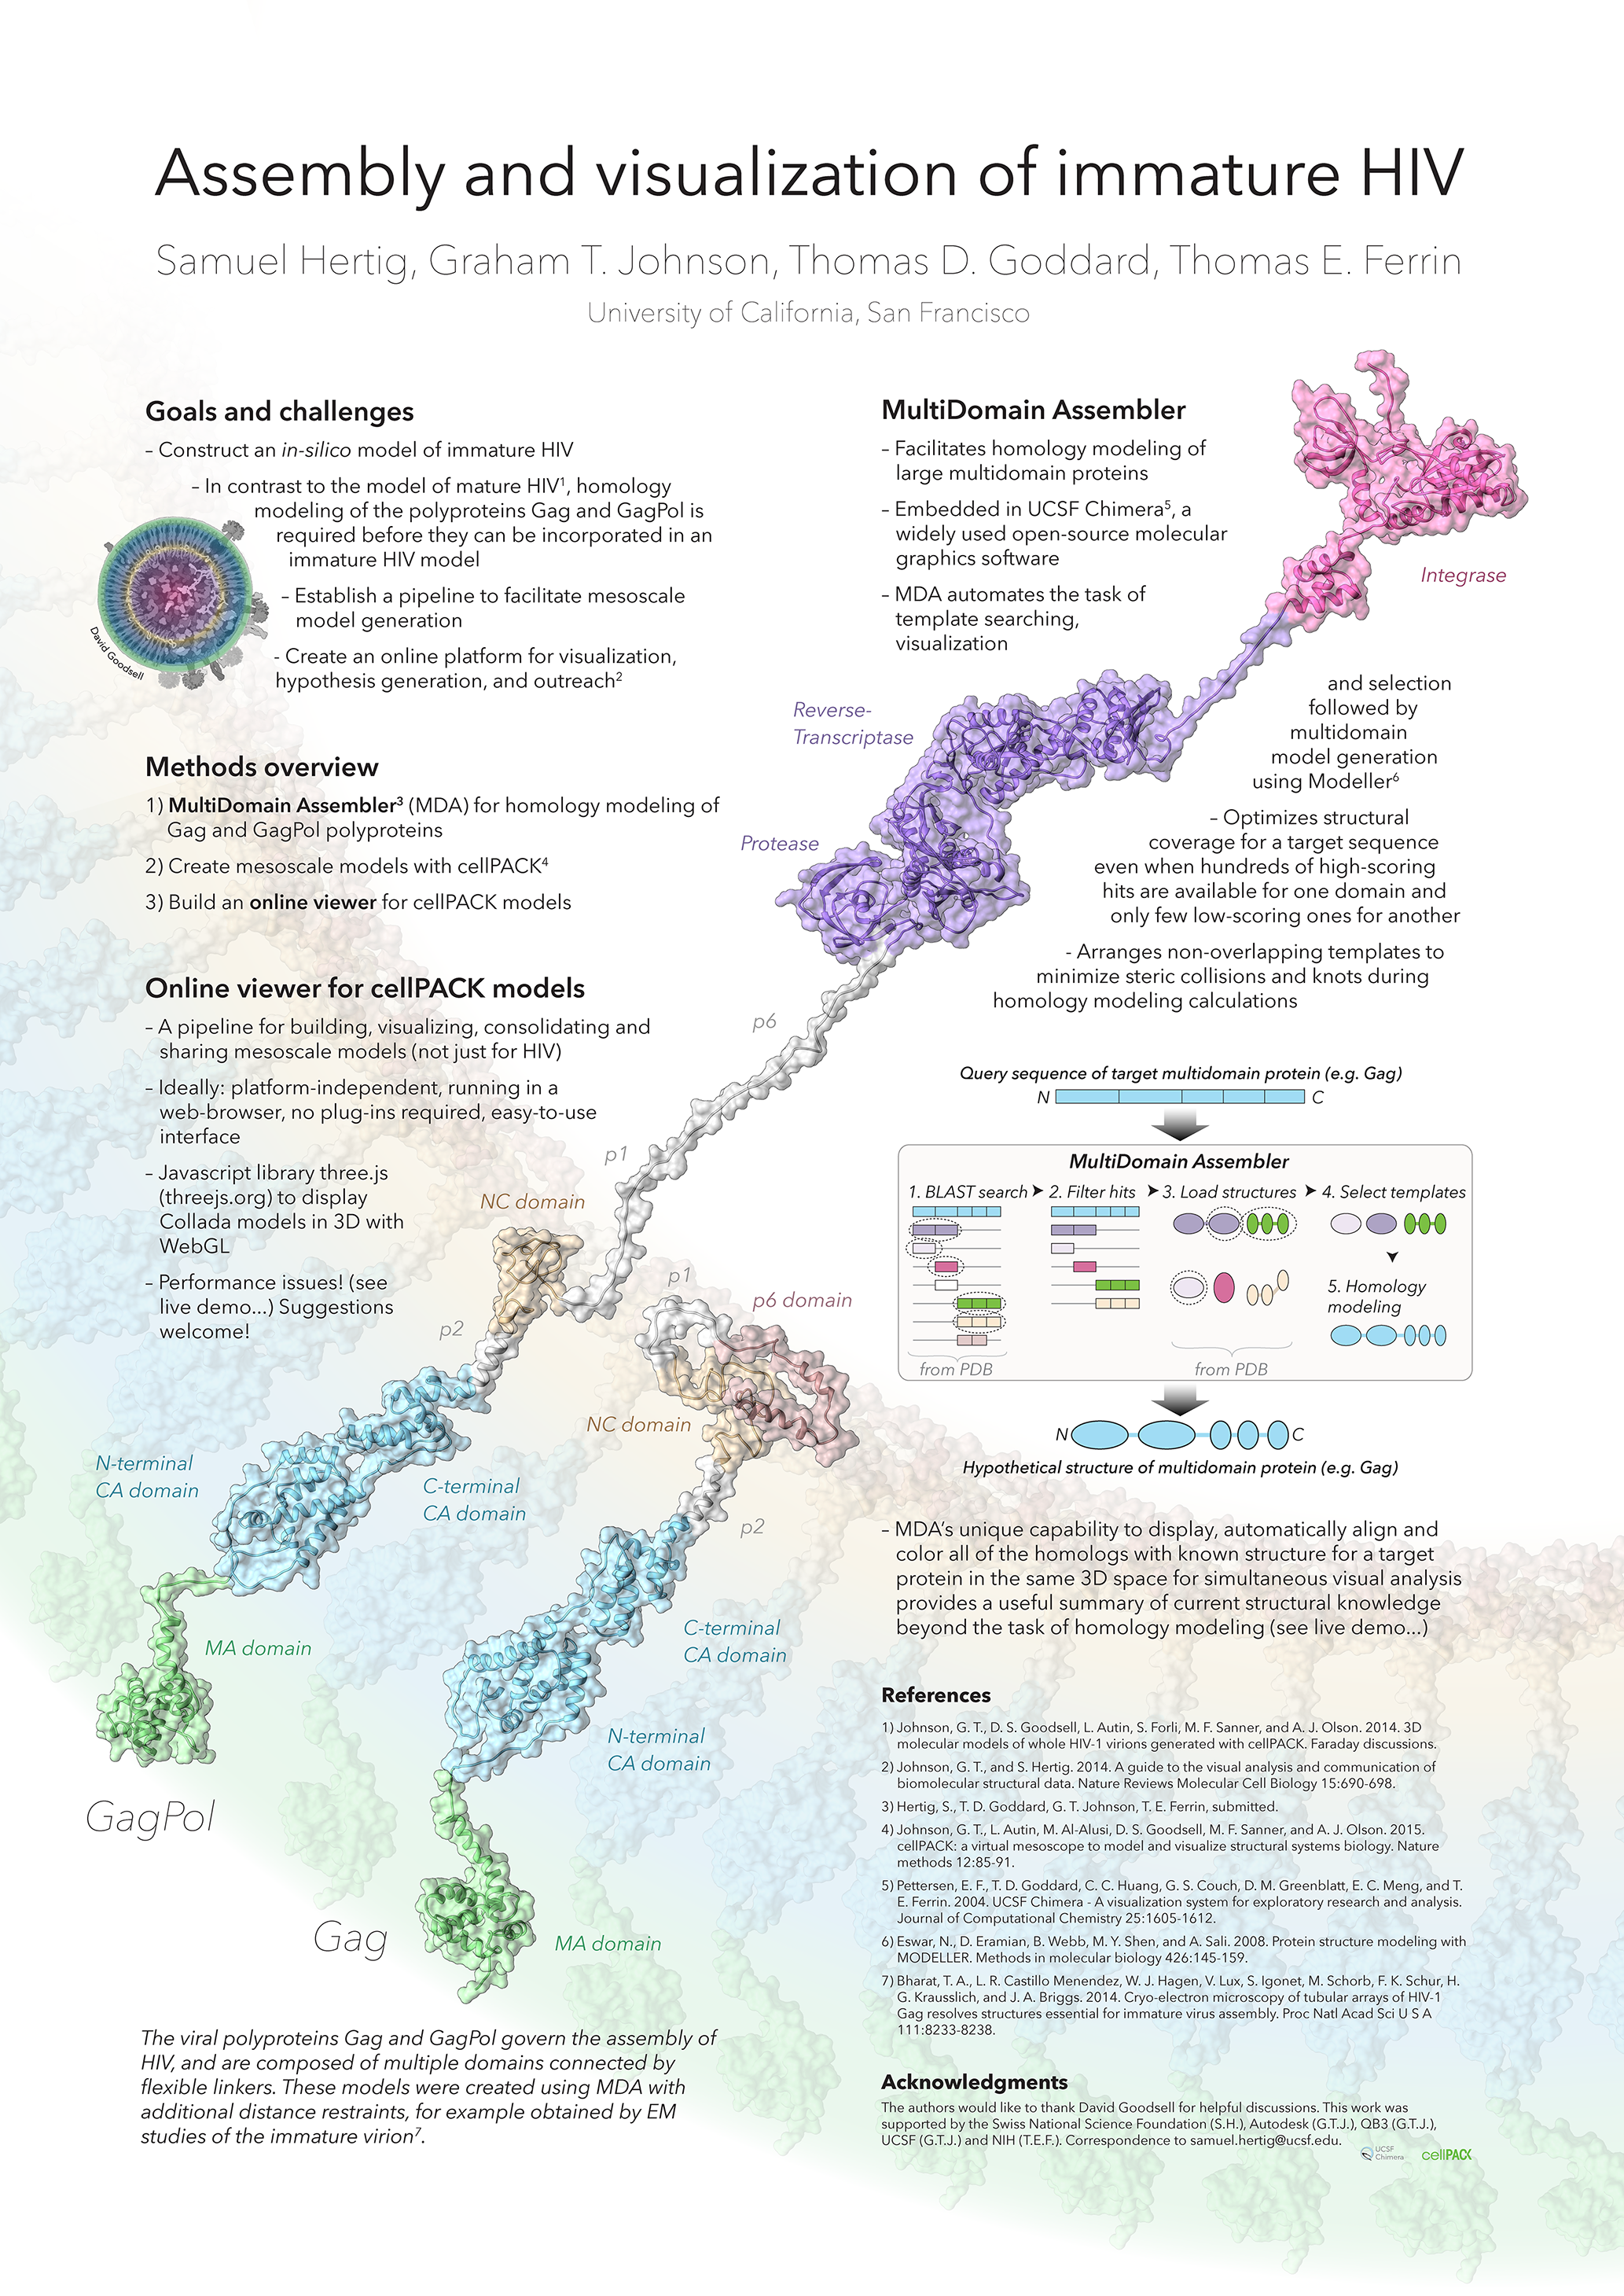
Sample 2:
Scientific Poster: This is the poster that I presented at the VizBi conference in 2015 and that won the best poster award. I think it was well received because it combines a clear layout with effective molecular graphics.
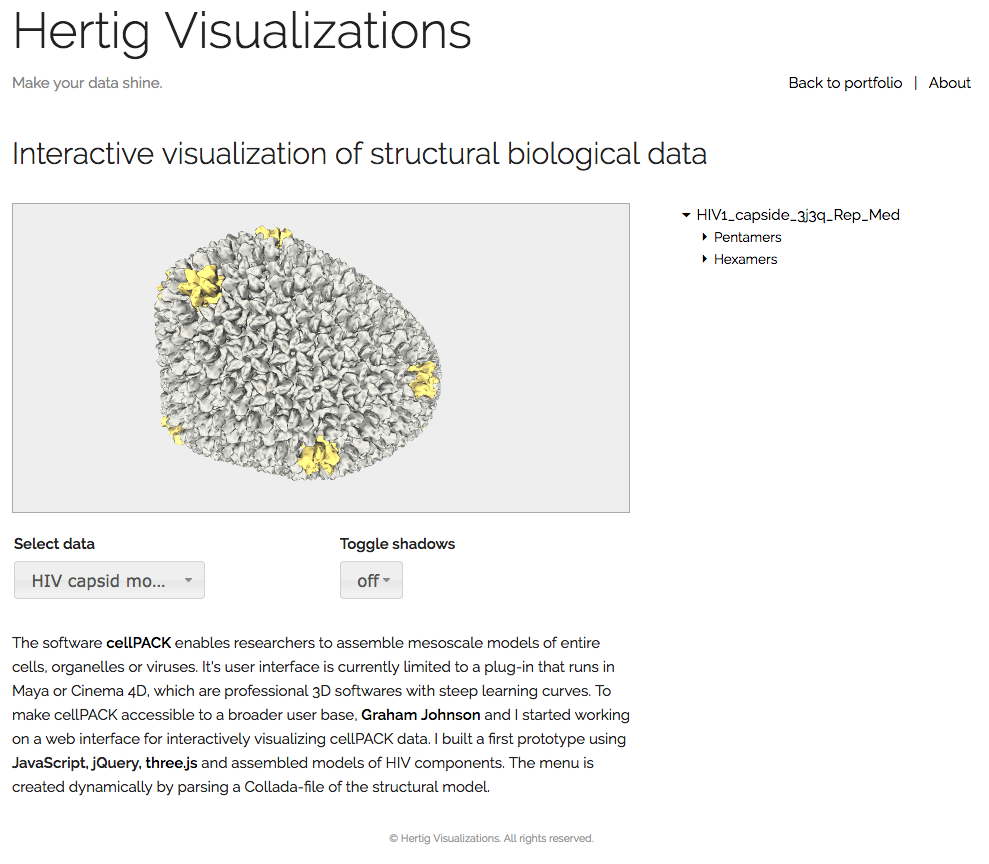
Sample 3:
Interactive web-viewer for structural biological data: It let’s you play with essentially the same data that is shown in the Lego-movie, but interactively in a browser. While this is just a prototype that I hacked together for Graham Johnson, it made me realize how powerful JavaScript and the web have become. I hope to add more refined interactive visualizations to my portfolio soon. You can explore the prototype in full here: http://samhertig.com/cpviewer.html.
Where do you think the field of scientific visualization is ‘going’? Do you perceive any trends in its evolution or are there certain directions that you would like to see implemented?
I am fascinated by the direction of which the interactive web is headed. WebGL is now well-established and widely supported, and thus browser-based 3D visualization and analysis tools will likely become more wide spread in the future. I do hope that scientific journals realize the huge potential and start offering a wider array of options for authors to showcase their work in the online supplementary sections. It might also transform the way scientists analyze, visualize and share their data.
And then let’s end with a simple question… What is your ‘10 year plan’ in terms of what you hope to accomplish in scientific visualization?!
After having established a solid client base, I would love to position myself as an expert for interactive scientific visualization, ideally in an area related to science outreach and education. As I gain more knowledge about some of the technical details, I could also imagine myself launching or contributing to a useful code library to empower others and make scientific visualization more accessible.