
Scientific Animator/Academic
Career Profile
Please introduce yourself (what is your current training/educational status and/or where do you work?) and share with us how you decided to get into scientific visualization.
I’m an associate professor at Aarhus University, Denmark where I run a Visualization Lab working with graphics and animation. I have always been fascinated by representing scientific data visually, and I’m lucky to be able to combine my enthusiasm for science and art/design in this field.
What do you like the most about this field?
I love that this field first and foremost brings together talented people from very different subjects and institutions. The core of the field and what makes it move forward is exactly the interdisciplinary significance.
How and where did you acquire your current skillset in scientific visualization? Was it all via a graduate or other program or are you self taught? If so, did you use any particular online resources to help with your training?
I am mostly self-taught, but did follow a Maya Fast Track course at Gnomon School of Visual Effects in Los Angeles a couple of years ago. I have great use of the Molecular Movies website, but also lot’s of excellent books. Most recently Eric Keller’s “Maya Visual Effects: The Innovator’s Guide”. I frequently develop my drawing skills by participating in course and meetings, such as this one held in Barcelona: http://www.transmittingscience.org/courses/draw/scientific-illustration/
What do you consider some of the biggest barriers to entering the field? Are they technical, training, scientific, professional (availability of jobs or projects)?
One of the biggest barriers is less of a barrier and more the mark of a young field: the few people involved professionally. Our small community has yet to reach a critical professional mass. Another challenge is the lack of sharing experiences and processes in terms of modeling.
How do you feel your PhD training has an impact on your scientific visualization work? What specific skills from your PhD training have empowered you in your scientific visualization work? Do you think your PhD training has given you a unique perspective on viewing, interpreting, and creating scientific visualizations?
My PhD was in science communication in general, and in that sense it has given me a valuable insight into communication means, methods and channels. More importantly training for a PhD has given me a greater understanding of what it takes to study a scientific subject thoroughly and perform accordingly. It takes excellence and dedication to keep digging into new scientific subjects and communicate that special knowledge, topic or feature to everyone else.
Can you provide a specific example/situation of where you think your PhD training changed the way you designed something, interacted with someone or navigated a situation?
When I start an animation process or a scientific drawing I always start by reading a lot of literature on the topic and have long conversations with the specialist scientists involved. My PhD training has definitely changed the way I interact with these scientists. I have a greater understanding and respect for their work and the scientific process.
Which practitioners (or what visualizations) have been most inspirational to you?
I am in a very privileged situation. Not only do I have great sources of inspiration, but I am able to interact with them, share ideas and talk about different ways of doing things. Among these people are David Goodsell, Gaël McGill, and Bang Wong.
Which conferences would you recommend to those interested in this field and why? What particular insights or benefits did you get out of attending this (these) conferences?
Go to SIGGRAPH! www.siggraph.org
Don’t think twice, just go ☺ You will not regret it. You’ll find so much more than what you were looking for. This is not a data visualization conference, nor is it a conference about science. It’s so different to what you’ll experience anywhere else. You’ll also get to meet people from the entertainment industry, people who knows things you don’t. Go!
If there was one resource, tool or conference that you could wish for to facilitate your work, what would it be?
SIGGRAPH. It would be great to get some more scientific data visualization represented.
What other advice would you offer those interested in either a professional or full-time academic career in scientific visualization?
Do it! A very dear friend of mine, who also happens to be a professor in chemistry, once said these very wise words: Surround yourself with people who knows things you don’t, who is more knowledgeable in areas that you’re not. Don’t be afraid to ask questions and to not be the smartest one in the room.
Please comment briefly on the samples/links that you have submitted for this profile… why in particular are you proud of these and what do you hope viewers will notice and get from seeing them?
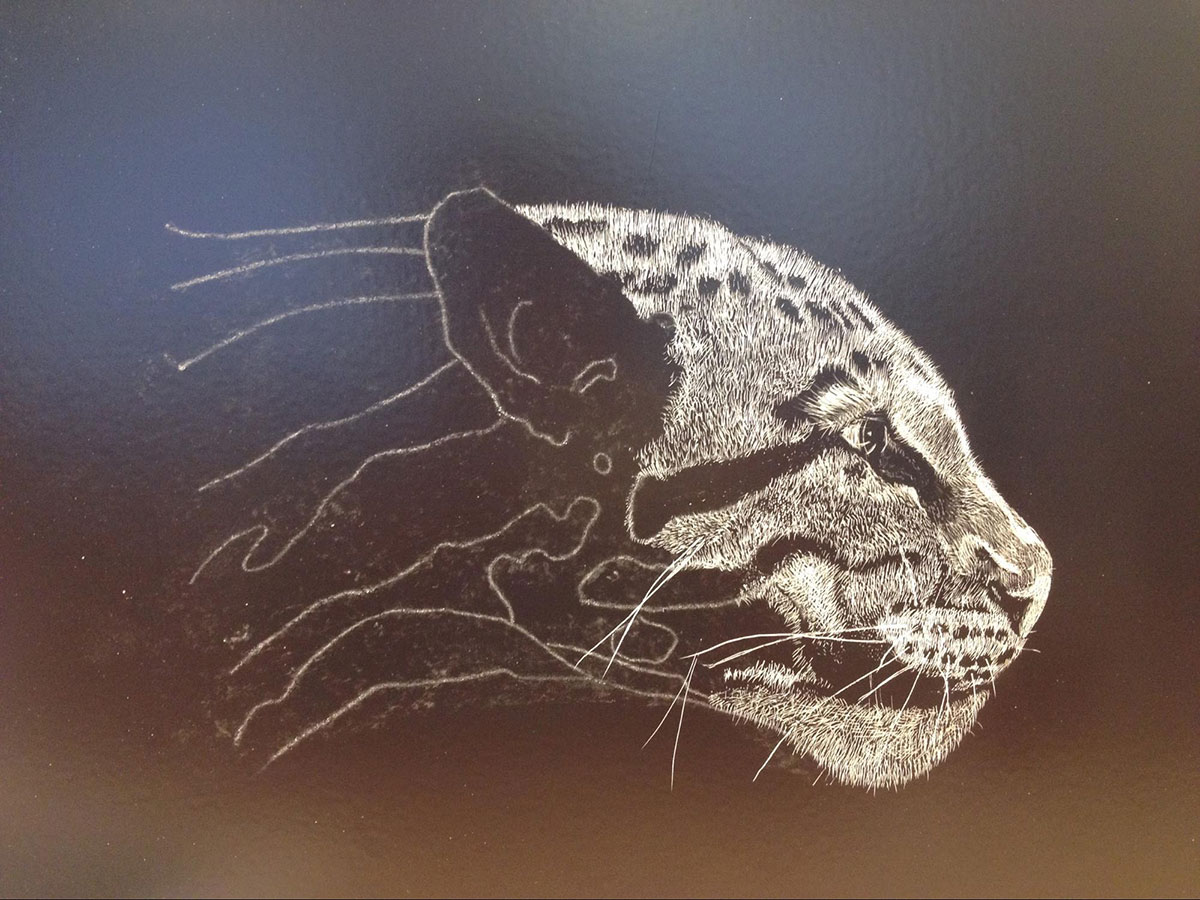
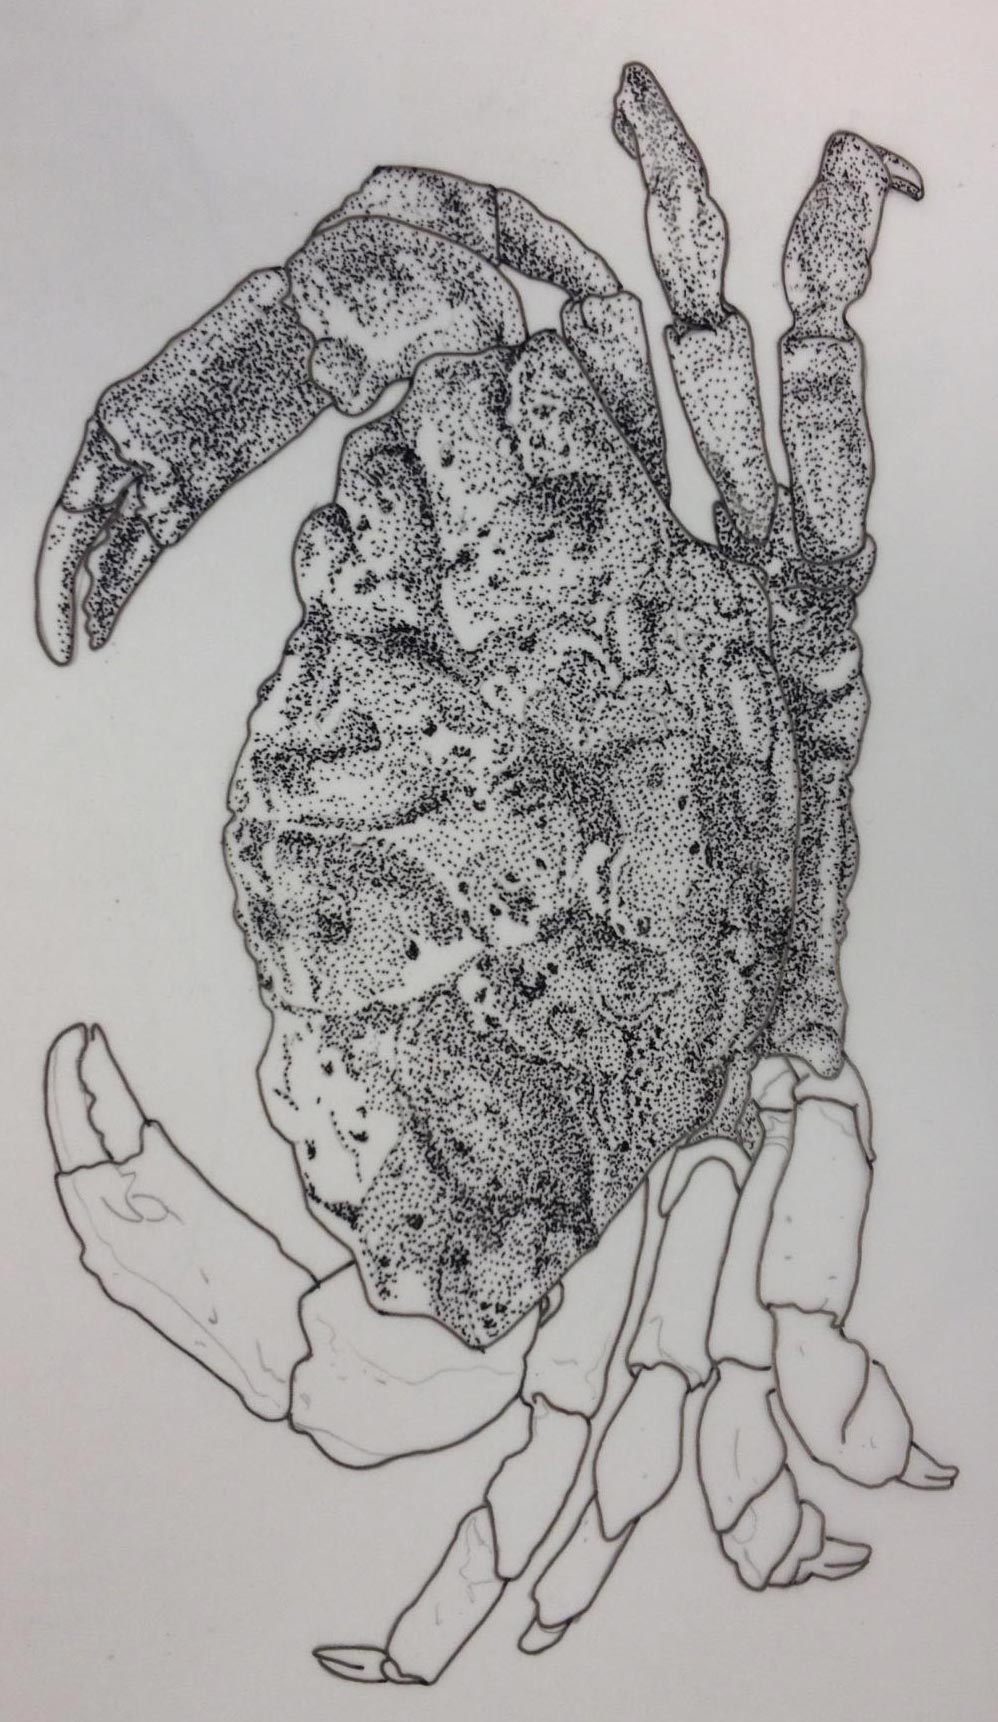
I chose to submit some recent work/drawings. These are special to me since they represent some of the first work I did using my “new” hands. I lost most of nine of my fingers to a bacteria in 2013, and thought my professional life as an illustrator was over. It wasn’t. The cheetah is done by scratching a plate with a very fine knife. The crab is done in ink, and shadows were made using tiny dots. They illustrate two very different techniques, and emphasize the necessary diversity of skills in scientific visualization.
Where do you think the field scientific visualization is ‘going’? Do you perceive any trends in its evolution or are there certain directions that you would like to see implemented?
Towards more 3D animation, not as a gimmick, but more profoundly as a serious tool to work, manipulate and interact with objects and data in the lab.
And then lets end with a simple question… What is your ‘10 year plan’ in terms of what you hope to accomplish in scientific visualization?
To continue to be at the very forefront of visual innovation. To catch one wave after the other. Never to be dragged down by the ordinary. Always explore the unexpected, look for right things in wrong turns, and keep an open mind.