

Academic
Career Profile
Please introduce yourself (what is your current training/educational status and/or where do you work?) and share with us how you decided to get into scientific visualization.
I am currently a PostDoc at UCSF working for Graham Johnson. My PhD was in Chemical Biology. I’ve always had a passion for art, I double majored in Chemistry and Art as an Undergraduate, but I never really saw a way to unite my two interests until I read an article in the New York Times featuring Drew Berry, Janet Iwasa, Gael McGill, and many others. I started teaching myself animation software on the side and contacted everyone I could find in the field to get advice on how to position myself so I could have a job after I finished my PhD.
What do you like the most about this field?
It contains all my favorite things about my graduate work: being exposed to new scientific ideas, problem solving, coming up with new conceptual models, and has a lot less of my least favorite things: bench work and failure.
How and where did you acquire your current skillset in scientific visualization? Was it all via a graduate or other program or are you self taught? If so, did you use any particular online resources to help with your training?
I was all self taught before I started working for Graham, and now I’m self taught with a mentor. I am always trying to surround myself with people who have the skills I want. Conferences are really amazing in that way; you get exposed to the field in a condensed way and then you can decide which aspects you want to pursue further. For Cinema4D Greyscalegorilla is a really great resource. For Maya I started with all the tutorials on molecularmovies.org, which was the precursor to this site. But I’d say I’ve learned the most by just working on projects and asking Graham questions.
How do you feel your PhD training has an impact on your scientific visualization work? What specific skills from your PhD training have empowered you in your scientific visualization work? Do you think your PhD training has given you a unique perspective on viewing, interpreting, and creating scientific visualizations?
I don’t think I could digest scientific concepts as quickly as I do if it wasn’t for my PhD training. My first two years of my graduate work it seemed like everyone knew so much more than I did, I saw people listening to talks without taking notes and then asking incredibly insightful questions, while I was only able to understand the introductory slide and the conclusion slide. But at some point the exposure to so much research just seemed to expand my brain, and I am now able to incorporate new knowledge in a way I couldn’t before graduate school. I’m still learning new things all the time, but I feel like the speed at which I am able to understand them is due to my PhD training.
Can you provide a specific example/situation of where you think your PhD training changed the way you designed something, interacted with someone or navigated a situation?
The project I am most proud of is a collaboration between our lab, the Mullins lab and the Chimera developers. The Mullins lab collected volumetric time series data of cells crawling over time to study cell motility. Our lab has been responsible for the visualization and working with the Chimera developer, Tom Goddard, on the analysis. This is very much a research project, where the visualization is contributing to the scientific process, and this wouldn’t be possible if I wasn’t also a researcher.
What do you consider some of the biggest barriers to entering the field? Are they technical, training, scientific, professional (availability of jobs or projects)?
I think the biggest challenge is still just not feeling like it’s a fully established field. I know there are people who have been working for quite some time now, and that medical illustration is a very established field, but on the molecular side it seems like people continually have to justify their work, especially within academia.
Which practitioners (or what visualizations) have been most inspirational to you?
Graham is obviously a big inspiration for me, which is why I wanted to work for him. I really look up to the people in academia, Janet Iwasa, Jodie Jenkinson’s lab and her work with Gael McGill for their ability to really push the research forward. On the art side the two people’s work I have up on my desk are Thomas Brown and Alexey Kashpersky.
Which conferences would you recommend to those interested in this field and why? What particular insights or benefits did you get out of attending this (these) conferences?
Siggraph: This was the first conference I went to when I was considering going into this field. I went to all the technical talks (which I highly recommend doing) and it was the first time I saw science and technology in the service of art. It was very inspiring.
GRC in Visualization in Science & Education: I like the academic nature of this conference, it is the one I keep going back to and look forward to the most.
AMI meeting: This is an expensive conference, and it’s been great for me for networking, but I don’t get as much out of the talks as I have at the GRC.
VizBi: I’ve only gone once, but when I went it was much more focused on software tools to visualize the genome.
If there was one resource, tool or conference that you could wish for to facilitate your work, what would it be?
I really think we need a better way to share files. So many people are doing redundant work, like animating DNA wrapped around histones. Instead of each person having to start from scratch I think there should be better ways to build on each other’s work, like the pdb. But in order for that to happen we also need better methods of attribution.
What other advice would you offer those interested in either a professional or full-time academic career in scientific visualization?
Reach out to people you want to work with.
When you do tutorials keep a log of what you learned along with saved files so when you come across that issue again you don’t have to relearn it. I’ve started keeping a blog the same way I would a lab notebook and I have found it really helpful.
Please comment briefly on the samples/links that you have submitted for this profile… why in particular are you proud of these and what do you hope viewers will notice and get from seeing them?
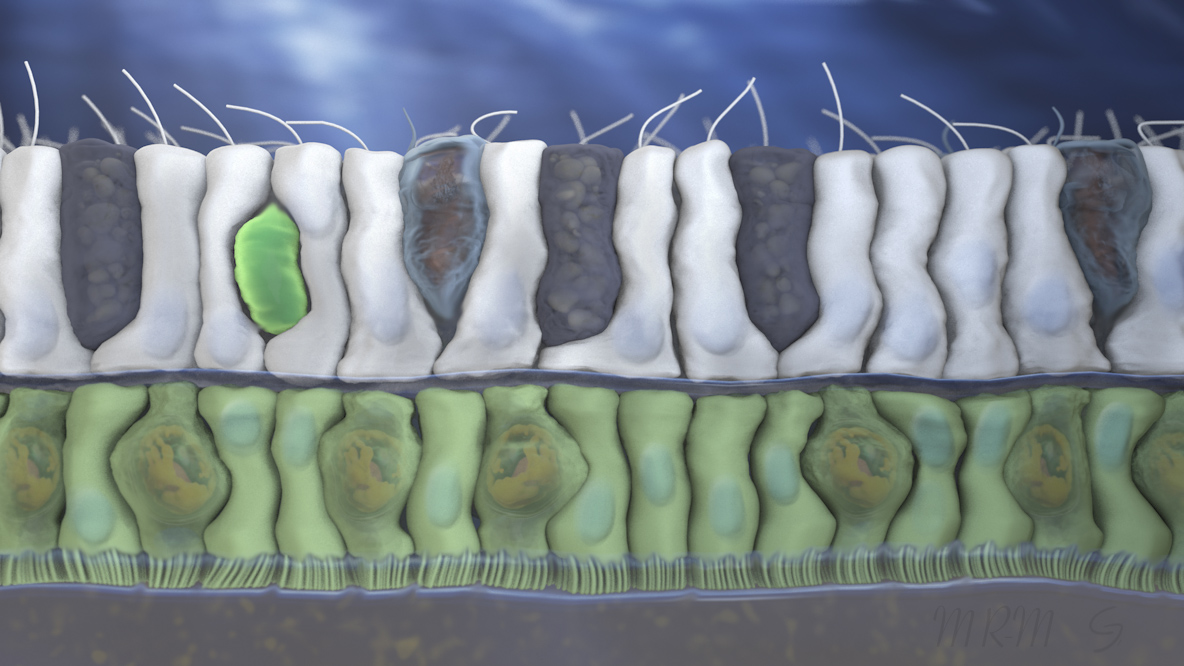
Sample 1: Coral cell biology, epidermis.
I am proud of how this turned out, but the thing I enjoyed the most was the method I used for setting up the cell layer. I made building blocks of 5 cells each and then randomly repeated those, and used a planer world displacer to make them curve side to side while maintaining the junctions at the basement membrane. I think it’s a good generalize method for making cell layers.
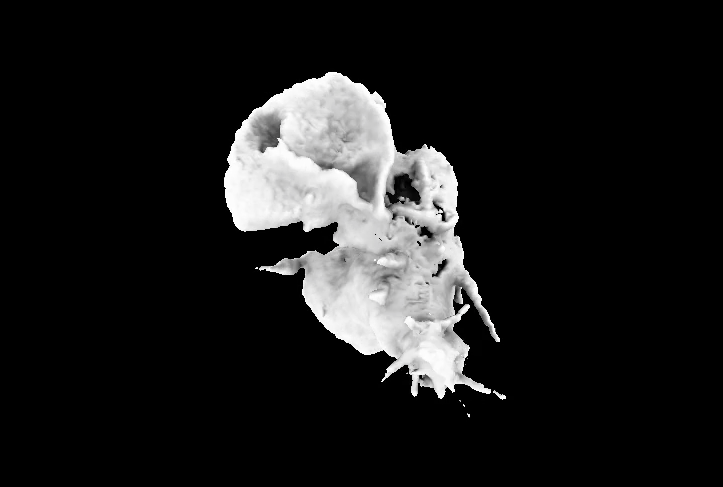
Sample 2: Still from video of HL60 cell crawling.
This is a still from a video of volumetric time series data acquired with lattice light sheet microscopy showing neutrophil crawling over time. This particular movie was rendered in UCSF Chimera using the ambient occlusion method developed by Tom Goddard. This data is some of the highest resolution images of cells moving that has been captured, and for me, it represents my favorite duality, where something is both technologically very complex, but also inherently beautiful.
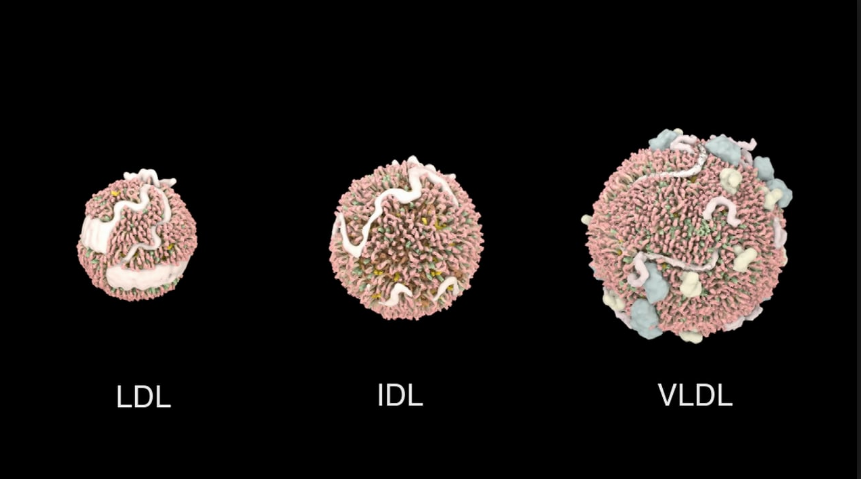
Sample 3: Low density lipoproteins.
I constructed these by packing the molecular structures and reported data of the total counts of each molecule (cholesterol, triglyceride, phospholipids). It was validating that the resulting radius matched the experimental data as well. I made these models for a diagnostic company in Boston and they’re using them to teach doctors about the many different types of low density lipoproteins.
Where do you think the field of scientific visualization is ‘going’? Do you perceive any trends in its evolution or are there certain directions that you would like to see implemented?
I think the trends are towards more interactive web based visualizations. I also really appreciate the efforts being made towards formalizing a publication method for animations and visualizations. I think seeing animations as scientific research endeavors in and of themselves is very important.
And then let’s end with a simple question… What is your ‘10 year plan’ in terms of what you hope to accomplish in scientific visualization?!
My dream is to build a PhD program in scientific visualization that would live in the intersection of computer science, art, and molecular biology. Short of that, I really don’t know where I’ll be in 10 years. I know I am drawn to learning new skills, and learning about new science, and so far just following my interests has paid off well.