

Biomedical Visualization Specialist
Please introduce yourself. What is your current training/educational status and/or where do you work? How did you decide to get into scientific visualization?
I work as a “Biomedical Visualization Specialist” for Cyberdata Technologies Inc, contracting for NICHD at the National Institutes of Health. I started as a fellow at the NIH in 2006, where I began supporting researchers websites, wikis, content management systems, photography, videography, and computer graphics. While I originally wanted to become a medical illustrator, I’ve instead become a facilitator/producer, creating opportunities and ensuring project completion when needed.
What do you like the most about this field?
I love it when I can help a researcher convey a complex concept in a simple, easy to understand format for communicating their research to each other and the public. It’s even better when my efforts empower a scientist to produce materials directly, or elucidate a new technique for interacting with their data or conducting research. When researchers can use tools directly rather than relying on myself or others, they are empowered to explore data in new ways and to operate more efficiently and independently with greater communication.
How and where did you acquire your current skillset in scientific visualization? Was it all via a graduate or other program or are you self taught? If so, did you use any particular online resources to help with your training?
I graduated with a B/A in Biomedical Communications from the University of Maryland, Baltimore County, where I studied Art and Biology through the Interdisciplinary Studies program. My understanding of biology has also been informed by experiences growing up around the woods and lakes of Minnesota and having trained as a combat lifesaver and a mechanic in the Army. (The military makes extensive use of illustration in training materials and mechanical diagrams and schematics.) I also benefitted through work for the Biology Department at Howard Community College where I was inspired by the educational materials created by Susan Bard and Mary Alice Jost for teaching biology through interactive training materials which they programmed using C++.
What do you consider some of the biggest barriers to entering the field? Are they technical, training, scientific, professional (availability of jobs or projects)?
I think that gaining experience initially is the hardest, because scientists and artists alike underestimate the difficulty in creating high quality graphics (and software). This leads to frustration, missing deadlines, going over budget, or working for less than a livable wage. Artists or their project managers must gather requirements from the client, simplify the message/intent, set goals and expectations, and then manage time and resources efficiently. This is especially difficult in the beginning, while learning new software and developing skills.
Which practitioners (or what visualizations) have been most inspirational to you?
I have been inspired and helped by so many people who have been generous with their time. Dr. Eric Martz is a immunologist who adapted a protein visualization app called RasMol to work in web browsers, enabling data interaction and scripted animations. Drew Berry’s molecular animations for HHMI’s DNA-Interactive project and Graham Johnson’s kinesin animation for the Milligan and Vale Science paper served as excellent examples while I was in school (and later Graham’s illustrations for Pollard and Earnshaw’s Cell Biology Textbook). After I graduated, I attended SIGGRAPH in 2006 and saw Janet Iwasa present her “Origin of Life” works in a talk, was able to meet Graham Johnson in the Molecular Graphics B.O.F. event, and saw XVIVO’s “Inner Life of a Cell”, all of which fueled my interest. Of course, David Goodsell’s work for the Molecule of the Month on the PDB has been monumental, including his book The Machinery of Life. More recently, I am inspired by the work of Alan Alda and his efforts to create the Center for Communicating Science™ at Stony Brook University. Also Randy Olson’s books “Don’t be such a Scientist” “Houston, We Have A Narrative” and “Connection”, which aim to help scientists effectively communicate to the public.
Which conferences would you recommend to those interested in this field and why? What particular insights or benefits did you get out of attending this (these) conferences?
vizbi.org Covers most aspects of applied biological visualization, and is beneficial to application developers, the biologists who are using software and also artists who work with biological data and visualization.
ami.org Is especially good for aspiring Medical Illustrators, but also to bioengineers, app developers, etc. While there is a strong focus on Human Anatomy, other species are covered as are various levels of science, including molecular biology and Histologies.
vesaliustrust.org The Vesalius Trust supports education in Health Science Communication and provides several grants and scholarships for students.
siggraph.org SIGGRAPH is a computer graphics convention which is light on science and heavy on entertainment media. This is the place to go if you’re interested in improving rendering and graphics capabilities with conventional graphics applications. There used to always something for the bioviz community, from the molecular graphics and 3D printing Birds of a Feather events to a few talks based around biology, but biomedical research is certainly an afterthought. For more hardcore “visualization” check out ieee’s VizWeek:
ieeevis.org and the sometimes co-located BioVis meeting: biovis.net provide a much deeper dive into the visualization of biological data. These are the conferences for people who are interested in applying computer science to these topics.
If there was one resource, tool or conference that you could wish for to facilitate your work, what would it be?
An interactive augmented/virtual reality anatomical viewer which supported visualization down to the molecular biology level in which figures and diagrams could be displayed and interacted with in real time.
What other advice would you offer those interested in either a professional or full-time academic career in scientific visualization?
Don’t skip steps… Take the time to dive into the content of each project and truly understand the science. Find ways to gain experience while getting paid and always deliver, even if late or difficult. Don’t burn bridges! Your toughest clients often become your greatest advocates. Avoid spec work and working for free, but volunteering can be worthwhile if someone invests their time and energy or provides access to tools or data which enables you to learn, grow and produce solid portfolio work. Lastly, (and I’m still working on this), learn to say NO! You can’t do every project. Know your limitations.
Please comment briefly on the samples/links that you have submitted for this profile… why in particular are you proud of these and what do you hope viewers will notice and get from seeing them?
The Golgi Apparatus animation and 3D print was interesting because it enabled us to show the entire golgi complex in both the actual data and in a visualization in a way which was counter to conventional understanding at the time.
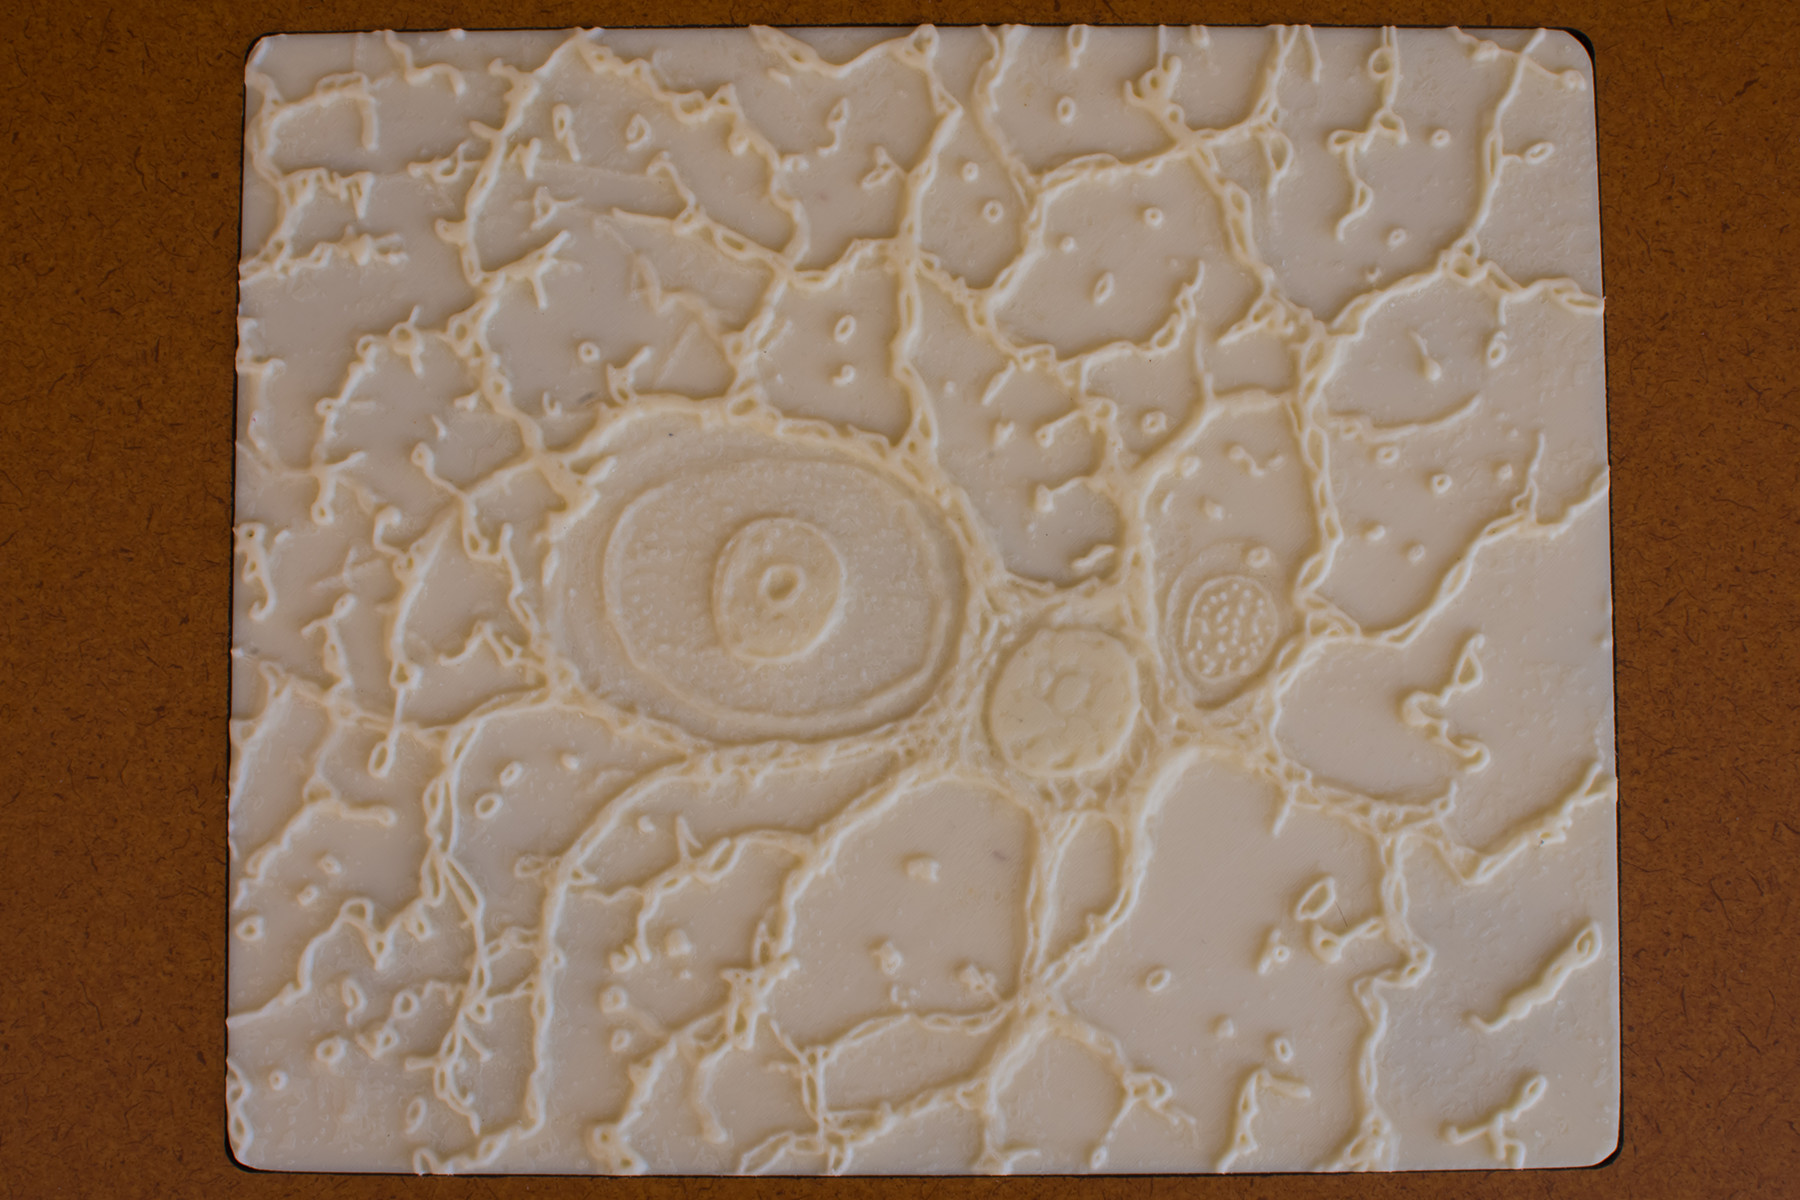
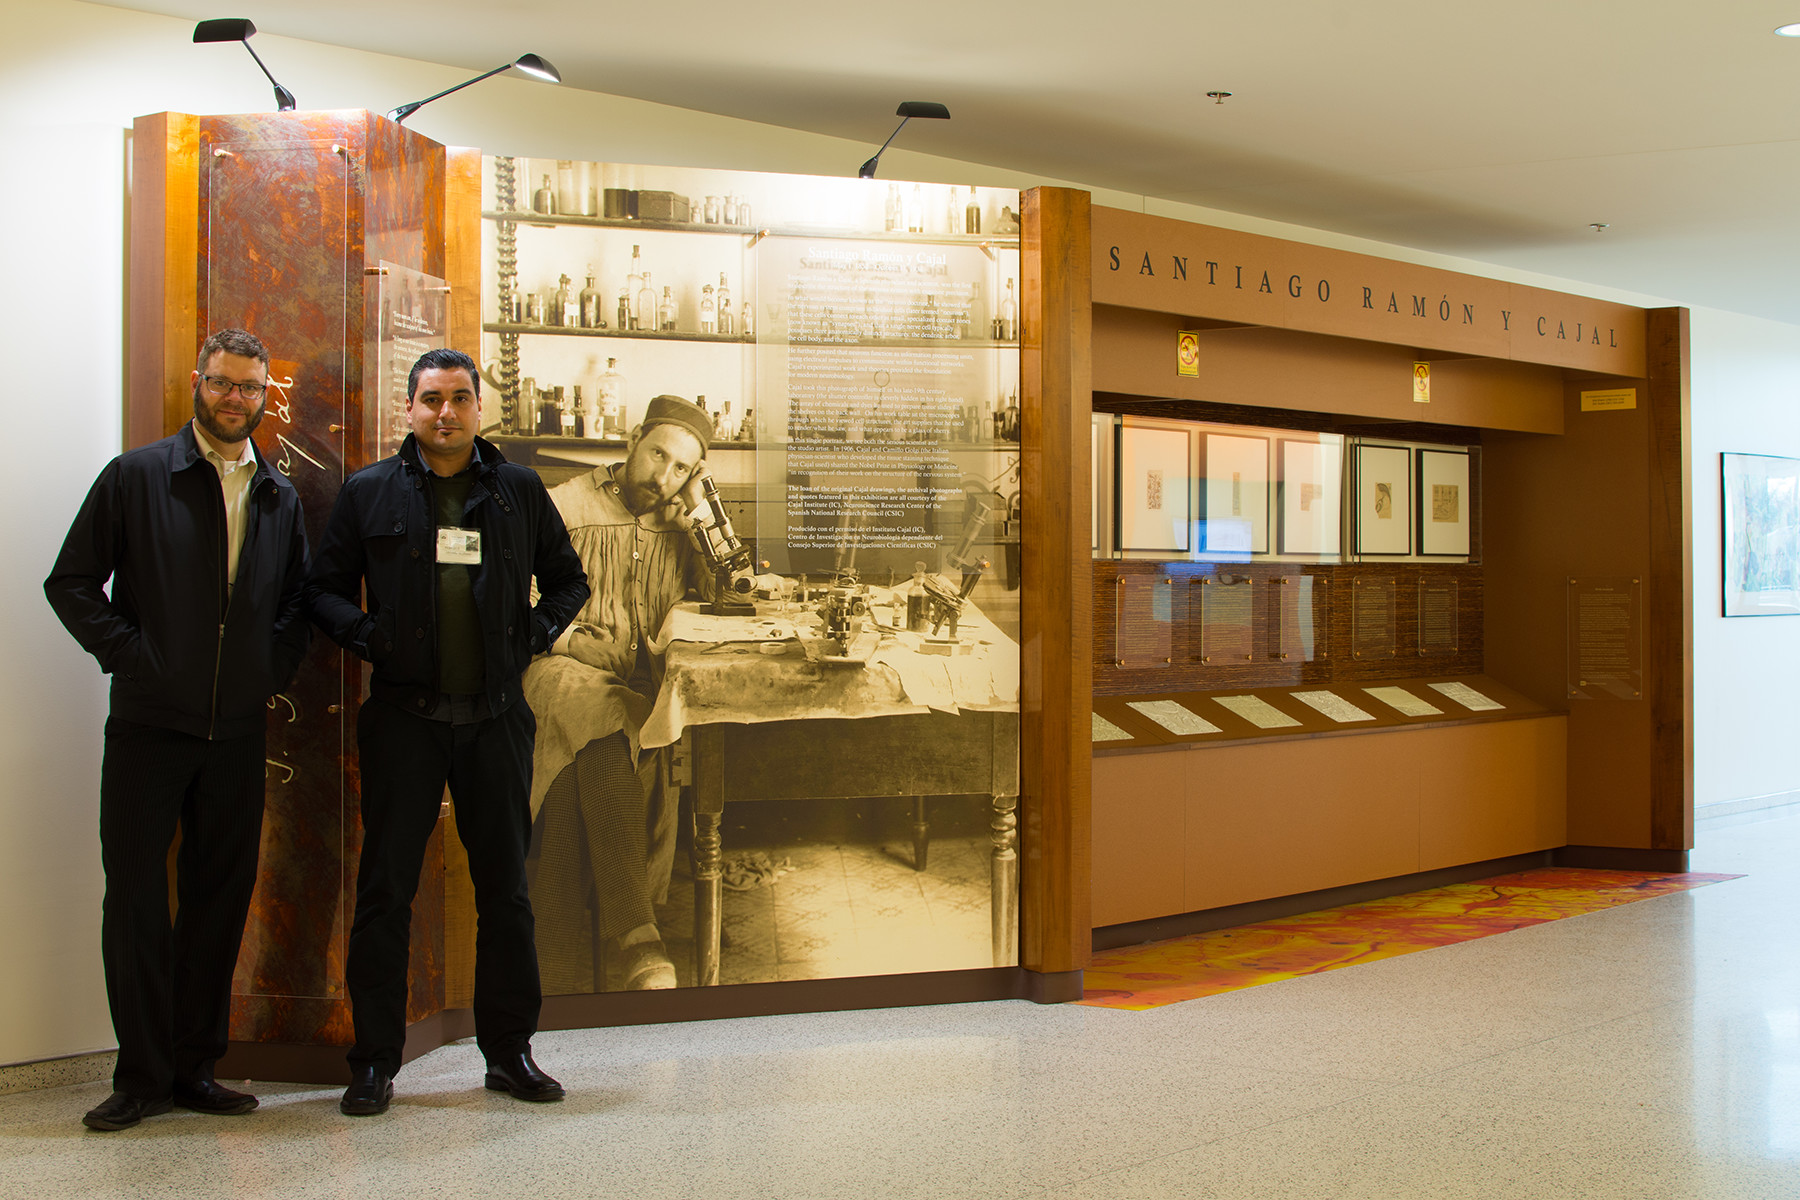
The Cajal project was interesting because it felt like I working for a client (Cajal) who was both highly skilled and incommunicado (having passed away in 1934). It was also interesting to adapt a couple of his pseudo-perspective drawings for a tactile 3D display, where simply making a height displacement map wouldn’t have represented the content accurately.
Where do you think the field of scientific visualization is ‘going’? Do you perceive any trends in its evolution or are there certain directions that you would like to see implemented?
Interactive, augmented and virtual reality is the future! Controlling the motion and actions of models and simulations through scripting and algorithms gives you insight into data and is certainly the future.
And then let’s end with a simple question… What is your ’10 year plan’ in terms of what you hope to accomplish in scientific visualization?
I hope to enable scientists to better utilize visualization tools more effectively to interact with their own data and to better communicate their research to other scientists, the public and especially the next generation of scientists while enabling this next generation to understand current thinking in biology more efficiently than previous generations. It’s also my hope that visualization tools can better enable the public to understand health and make better health decisions. I’d like to help usher in Virtual and Augmented Reality applications in science.