

MA, MS, CMI
Medical Illustrator, Academic
Career Profile
Please introduce yourself (what is your current training/educational status and/or where do you work?) and share with us how you decided to get into scientific visualization.
I am Professor and Director of the graduate program in Medical Illustration at Rochester Institute of Technology (RIT). I teach a wide variety of courses, from human gross anatomy and surgical illustration to computer graphics and scientific visualization.
I started in the sciences, earning a bachelors degree in Biology and Geology at Cornell and doing graduate work in paleontology and anatomy at the University of Texas and University of Rochester. Two things happened while at Rochester: I decided that I no longer wished to pursue the PhD and I discovered the medical art of Dr. Frank Netter while taking anatomy at the medical school. I decided to become a medical illustrator and entered the graduate program at RIT. After graduation, I worked a few jobs illustrating medical textbooks and medical trial exhibits before returning to RIT to join the faculty in 1998.
In addition to my teaching, I continue to illustrate medical texts including Robbins Pathologic Basis of Disease and Guyton’s Textbook of Medical Physiology. I’m also part of a small team of artists and scientists who create new artwork in the tradition of the late Dr. Netter. I do most of the physiological, cellular, and molecular art for new titles in the Netter collection, including Netter’s Atlas of Human Physiology, Netter’s Atlas of Neuroscience, and Netter’s Illustrated Pharmacology.
How did you decide to get into scientific visualization?
While working as a medical artist in the mid-1990s, I often received requests from my clients to illustrate the molecular structure of certain drugs and their interaction with receptors and other proteins. With the Internet still in its infancy, I was frustrated by the difficulty in finding accurate references for these molecules. Eventually I discovered several online databases of molecules (including the Protein Databank) as well as molecular visualization software to view them. Initially I used Mage (by Jane Richardson), RasMol (Roger Sayle), and WebLab Viewer Lite (MDL Information Systems) to export low-resolution raster images, which I could redraw in Adobe Illustrator. Later I discovered that WebLab Viewer Lite could export VRML files for rendering in Strata Studio Pro and other 3D software. I now use PyMol, Chimera, VMD, and ePMV in much the same way, with most rendering still done in Illustrator or Maxon Cinema 4D.
What do you like the most about this field?
The thing that has always appealed to me about medical illustration is the challenge of visually communicating complex medical and scientific information to a variety of audiences. Medical illustration is just a subset of scientific visualization that focuses on applications of scientific discovery to human medicine.
How and where did you acquire your current skillset in scientific visualization? Was it all via a graduate or other program or are you self taught? If so, did you use any particular online resources to help with your training?
The graduate program at RIT taught me the general principles of visually communicating complex medical and scientific concepts. But I don’t think there was a program anywhere in the world that was teaching the tools of molecular visualization in the early 1990s. I learned all of that on my own – how to locate the models, different ways of depicting molecular structures (space-filling, ribbon, surface models, etc.), how to manipulate the models in molecular visualization software, and how to export the models for rendering in other software. I now teach all of these techniques as part of a Scientific Visualization class at RIT.
What do you consider some of the biggest barriers to entering the field? Are they technical, training, scientific, professional (availability of jobs or projects)?
Certainly the lack of jobs specifically in scientific visualization is a problem, although many of these tools can be applied to more general positions in medical and scientific illustration. I think a bigger problem is the old stereotype that artists are not analytically inclined and vice versa, i.e., the left brain-right brain dichotomy. Medical and scientific illustrators are the rare exceptions, of course, but most students are groomed for one track or the other at an early age and are not encouraged to explore their artistic and scientific interests simultaneously. For that same reason, scientists often underestimate the value of a trained artist in helping to communicate scientific discoveries.
Which practitioners (or what visualizations) have been most inspirational to you?
As I learned more about molecular visualization, I became fascinated by its history and began to learn about some of the pioneers of molecular art. Roger Hayward, originally trained as an architect, illustrated all of Linus Pauling’s books including his hugely popular General Chemistry textbook. In 1964, Pauling and Hayward collaborated on the book The Architecture of Molecules, featuring dozens of Hayward’s beautiful pastels of crystal structure.
Another influential molecular artist was Irving Geis. Also trained as an architect, Geis was the first to illustrate the complete structure of a protein – myoglobin – which was solved by x-ray diffraction in the late 1950s. Geis illustrated many other proteins for the cover of Scientific American and collaborated with biologist Richard Dickerson on the wonderful little book The Structure and Action of Proteins (1969).
Other influential molecular illustrators include Jane Richardson at Duke University, who popularized the ribbon representation of proteins, and David Goodsell at the Scripps Research Institute.
Which conferences would you recommend to those interested in this field and why? What particular insights or benefits did you get out of attending this (these) conferences?
Every year I attend the Association of Medical Illustrators (AMI) conference. This is one of very few conferences that brings together experts in medical science, computer graphics, medical communications, and visualization. It also features an exhibit (salon) of cutting edge scientific art, animation, and interactive media. I’ve always been interested in attending some of the Gordon Research Conferences on molecular biology and science education, but I’ve never found the time.
Please comment briefly on the samples/links that you have submitted for this profile… why in particular are you proud of these and what do you hope viewers will notice and get from seeing them?
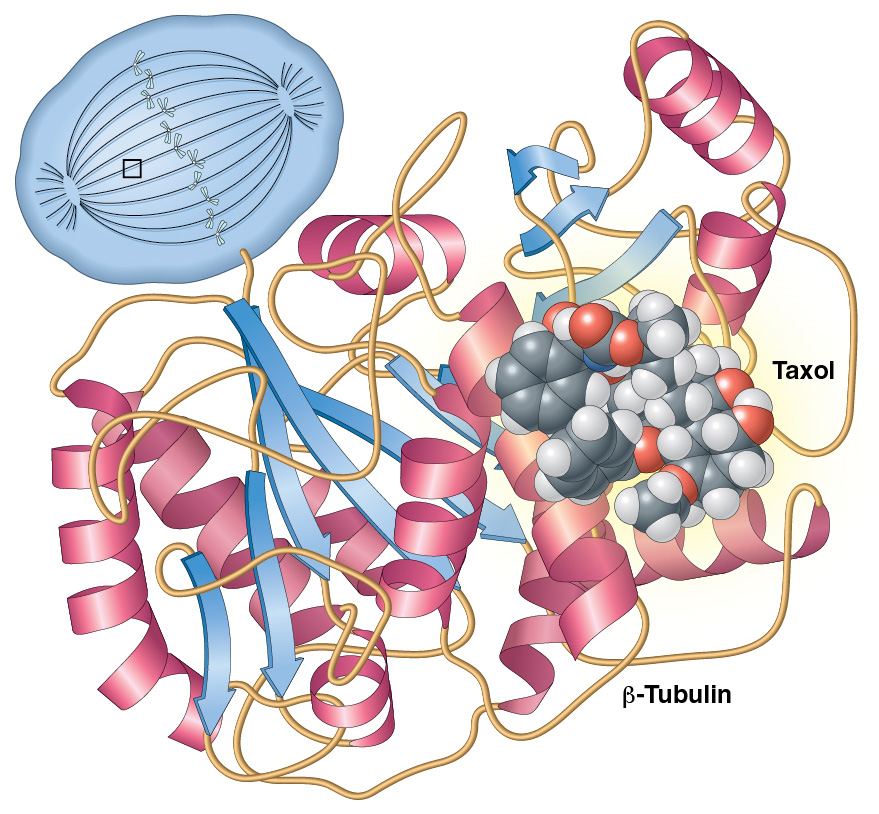
Sample 1 – Docetaxel. This is one of my earliest molecular illustrations, created in Adobe Illustrator using references exported from WebLab Viewer Lite. It shows the chemotherapy drug docetaxel (Taxotere®) binding to the protein beta-tubulin, part of the alpha-beta tubulin dimer that makes up microtubules. The drug prevents the breakdown of the mitotic spindle, arresting dividing cells in metaphase.
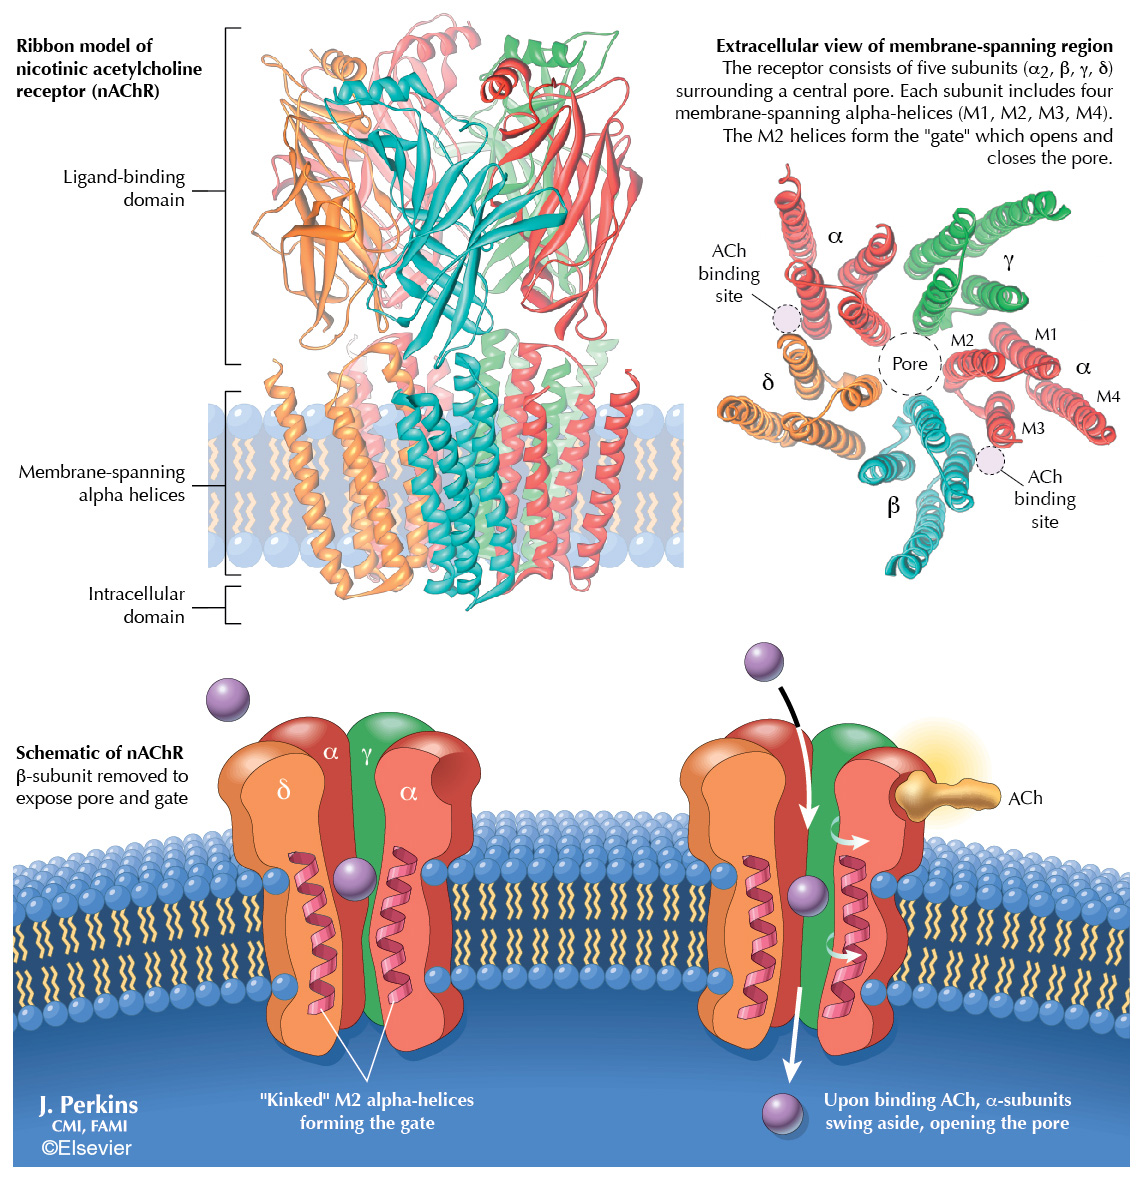
Sample 2 – Nicotinic Acetylcholine Receptor. This shows the structure and action of the nicotinic acetylcholine receptor (nAChR). The ribbon models show the position of the receptor in the cell membrane and its detailed structure comprising beta, gamma, delta, and two alpha subunits. The simplified schematic demonstrates that binding of acetylcholine (ACh) causes a conformational change in the M2 helices of the alpha subunits, opening an ion pore. This was one of 139 plates that I created for Netter’s Illustrated Pharmacology. I’m particularly proud of this project because the authors were pleasantly surprised by my knowledge of molecular biology and stated in the acknowledgements that my “…contributions to the subject matter were an unexpected bonus.”
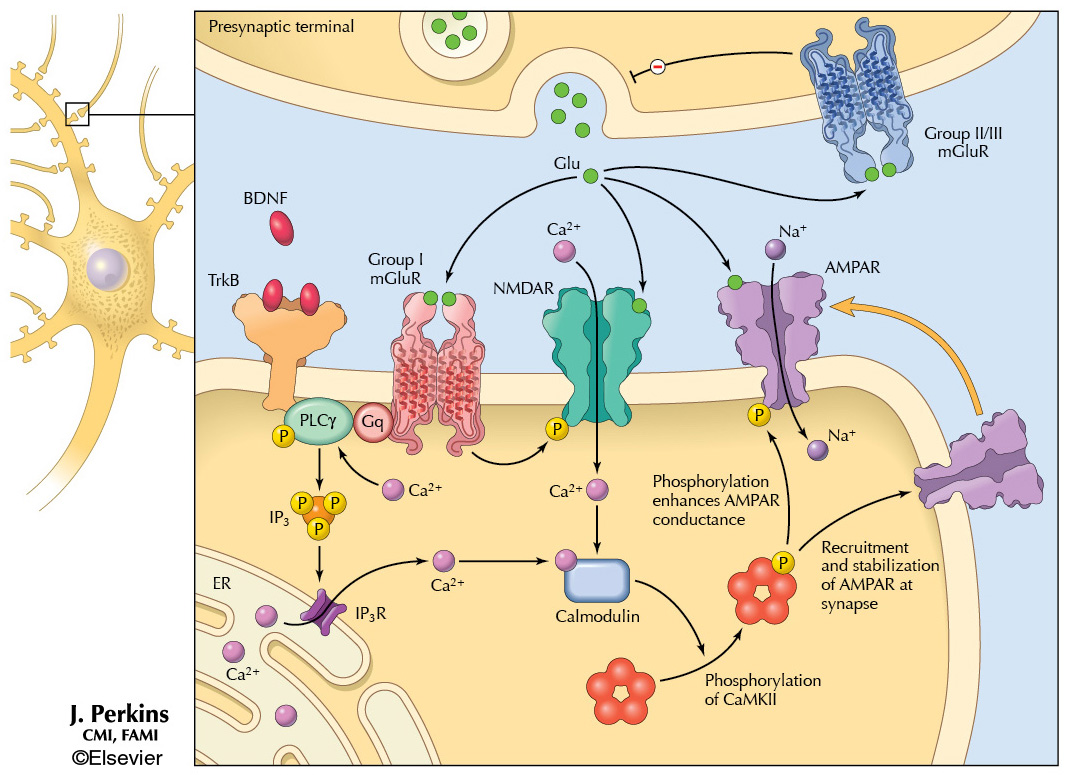
Sample 3 – Glutamate signaling. One of my most recent molecular illustrations, this was created for the 3rd edition of Netter’s Atlas of Neuroscience (2015). The amino acid glutamate functions as an excitatory neurotransmitter, stimulating postsynaptic receptors including AMPAR, NMDAR, and Group I mGluR. Glutamate action is modulated by presynaptic Group II/III mGluR, resulting in feedback inhibition, and by binding of brain-derived neurotrophic factor (BDNF) to TrkB. Protein Databank files were used as templates to draw simplified versions of the receptor molecules.
Where do you think the field scientific visualization is ‘going’? Do you perceive any trends in its evolution or are there certain directions that you would like to see implemented?
The explosion of information in the field of bioinformatics has created a large demand for data visualization, i.e., the ability to make sense visually of huge amounts of numerical data.
Another trend I’ve observed over the past decade or so is a shift away from representing molecules as simple geometric shapes and instead showing simplified versions of their actual shapes. After all, the function of a molecule, especially a protein, is often dictated by its three dimensional shape. Therefore, important information may be gleaned from showing molecules in their true shape, rather than representing them as random blobs or, worse, as circles and rectangles. I believe Graham Johnson (currently at UC San Francisco) referred to this as “molecular anatomy.” A textbook he illustrated, Cell Biology by Pollard and Earnshaw, is an excellent example of this approach. Ideally, all artists will adopt this “molecular anatomy” approach so that, one day, students will recognize important molecules by their shape, just as they recognize a picture of a stomach, kidney, or spleen from its basic shape.
And then lets end with a simple question… What is your ‘10 year plan’ in terms of what you hope to accomplish in scientific visualization?
I never expected to become a medical illustrator. When I decided to become a medical illustrator, I never expected to end up back in academia. As a medical illustrator, I always thought I would draw anatomy and surgery. I never expected that I would focus on physiology, pathology, and molecular biology. I’ve never had a plan. Why start now?
Seriously, though, I don’t have any lofty goals or ambitions. I’m in the twilight of my career and I feel that I’ve already accomplished a lot. The tools change every year, but my goal has always been the same – to produce clear, accurate illustrations that effectively communicate complex information. I suspect I’ll continue to illustrate textbooks as long as that remains a viable medium. But you never know.
Portfolio Link: www.netterimages.com/artist-james-a-perkins.html