

Scientific Animator
Career Profile
Please introduce yourself (what is your current training/educational status and/or where do you work?) and share with us how you decided to get into scientific visualization.
I have a MS in Biomedical Visualization (BVIS) from the University of Illinois at Chicago (UIC) and a master’s degree in Biotechnology from Harvard. I also worked as a researcher for 9 years in the pharma/biotech industry. I’m currently a communications and design lead at LifeLearn, a veterinary marketing and eLearning agency where I lead the design and development of interactive, illustrated and animated digital media content.
I believe my experience creating a 3D animation with one of my professors at Harvard was the impetus for me to join the field of biomedical visualization. That animation was for an epigenetics class, and I love the fact that it would help students understand the complex biological process. I also audited the molecular visualizations class at Harvard Medical School taught by Dr. Gaël McGill. And as a researcher in a biotech lab, I learned that one of the most challenging things is actually finding the most appropriate way to visualize scientific data, specifically, the proteomics, genomics data layered with clinical or pre-clinical data sets. It was the combination of these experiences that made me realize I want to have a career that focus on visualization of science.
What do you like the most about this field?
I love the fact that I can blend my creative skills and scientific knowledge to produce visual solutions that can advance science education, helping people comprehend complex information. I also get to work with bright and creative colleagues and learning never stops in this field.
How and where did you acquire your current skillset in scientific visualization? Was it all via a graduate or other program or are you self taught? If so, did you use any particular online resources to help with your training?
Most of my skill sets in scientific visualization are acquired from UIC BVIS, one of the four accredited graduate programs in medical illustration in North America. BVIS is known for embracing new technologies, and have access to facilities such as immersive virtual reality environment – CAVE and a haptics lab. I was able to do both animation and interactive design during my time there. As for resources, I’ve been using a combination of Lynda.com tutorials (free for Toronto Public Library card holders), YouTube (Mt. Mograph), Video Copliot (for their special effects & motion graphics tutorials for Adobe After Effects), VMD as a molecular and Molecular Movies/Clarafi.com to keep up with my animation skills and to learn new software and techniques.
What do you consider some of the biggest barriers to entering the field? Are they technical, training, scientific, professional (availability of jobs or projects)?
For me personally the biggest barrier was finding the time and opportunities to do science visualization while working as a full-time researcher. Depending on the lab and institution you are affiliated with, it may not be feasible. That’s why I decided to attend one of the accredited medical illustration schools and enter the field through this network. Many medical illustrators do freelance works, with advancement in technologies, there should be a lot of opportunities for visualizing science and enough jobs for everyone entering the profession. But we may need to better market ourselves and make this profession more widely known, so that companies and institutions would know to find us and utilize our skills.
Which practitioners (or what visualizations) have been most inspirational to you?
Growing up watching Disney and Studio Ghibli animated movies made me fall in love with animation, it’s amazing how a few seconds of footage can convey something that would take up a few paragraphs to describe. In general, works that brings innovation to the field of scientific visualization, whether it’s making a tool for scientists to create animations of their own research or showing molecular processes through a well-crafted illustration, inspires me.
Which conferences would you recommend to those interested in this field and why? What particular insights or benefits did you get out of attending this (these) conferences?
I have attended The Association of Medical Illustrators (AMI) meetings and (Visualizing Biological data) VIZBI. The AMI meeting is the largest meeting for medical illustrators; it’s a good place to meet practitioners from almost all the medical illustration specialties, ranged from surgical illustrators to medical app designers and animators. I really enjoy seeing the artworks exhibited in the salon at AMI meetings, there’s just so much creativities. At VIZBI there are more bioinformaticians, structural biologists and biophysicists in attendance. I like the small group breakout sessions at VIZBI, the attendees get to suggest topics relevant to biological data visualization for discussion and afterwards reconvene to share their ideas with the large group. Both of AMI and VIZBI conferences do have topics that overlap, they are both interdisciplinary, intersection of art and science.
If there was one resource, tool or conference that you could wish for to facilitate your work, what would it be?
I use PDB a lot for my molecular visualization works so I would like a very intuitive molecular viewer designed for science illustrators/animators. PDB header files are great and give you a lot of information, but it can be intimidating for most people.
What other advice would you offer those interested in either a professional or full-time academic career in scientific visualization?
Seek out and talk to someone who is currently working in this field and whose career path fits with your interests. I find that people in this profession are very generous with their time and very willing to help budding medical illustrators. Also try to attend meetings such as AMI or VIZBI to get a sense of what the community is like and what people are working on.
Please comment briefly on the samples/links that you have submitted for this profile… why in particular are you proud of these and what do you hope viewers will notice and get from seeing them?
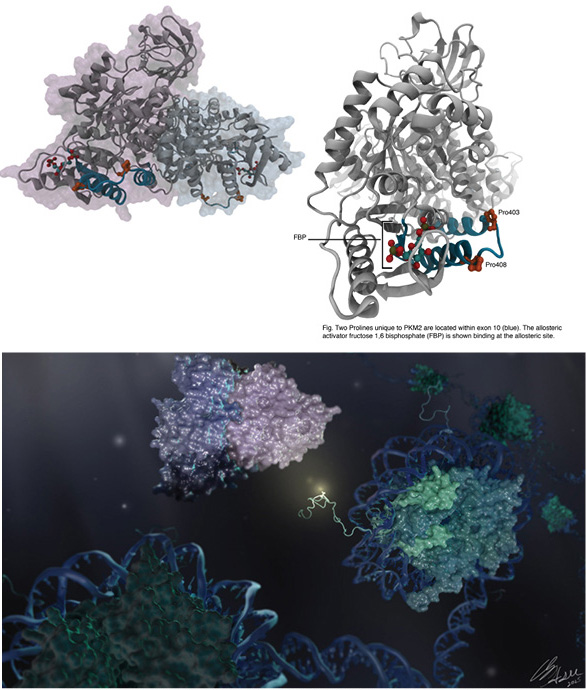
The first set of illustrations is depicting the role of pyruvate kinase M2 isoform in tumorigenesis. It’s part of my course works for the molecular pharmacology class at UIC BVIS, the challenge was to highlight an exciting new area of research by providing three different visualizations to a broad range of audiences: scientific, business investors and an image that could be used in a conference promotional banner. We get to utilize our understanding of the science and identified, conceptualized, rendered and responded to visual storytelling appropriate for the target audience. Extensive research and literature review was conducted to maintain scientific accuracy. I want people to know that we are more than artists making pretty pictures, we are also highly trained scientists.
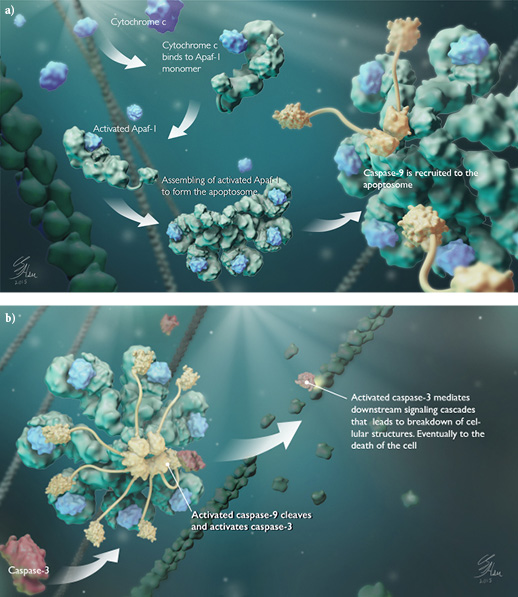
The second set of illustrations highlight the mitochondrial pathway of apoptosis, this is a post-graduation work that I did after watching one of the Clarafi.com tutorials. I’m always curious about other medical illustrator’s techniques and process, I want to fine-tune the skill sets I acquired in graduate school. It’s very easy to forget how to use 3D software such as 3ds max and Maya, so I would encourage people who are interested in this type of visualization to keep at it, keep learning and playing with it.
Where do you think the field scientific visualization is ‘going’? Do you perceive any trends in its evolution or are there certain directions that you would like to see implemented?
There are a lot more people incorporating interactive and/or immersive technology. I personally am very interested to explore “scientific gaming”. Not everything needs to be gamified, but it’s intriguing to think about how it could be successfully applied to data analysis/visualization and how can they be applied to educate specific audiences.
And then lets end with a simple question… What is your ‘10 year plan’ in terms of what you hope to accomplish in scientific visualization?
There are three areas in visualization I would like to explore: 1) help scientists showcase their research to a wider audience, 2) user-center design for education, to enhance learning & retention of information, and 3) biological data visualization. I hope to accomplish this through my day job as well as freelance opportunities, so these would keep me busy in the next few years. I am interested in utilizing technology and visualization in a way that can produce long lasting positive health behavior, so if opportunity arises I would love to volunteer my time with a NGO to create health education materials.
Portfolio: www.hsubiomedicalvisual.com/
VIZBI poster: vizbi.org/Posters/2015/C01