

Academic
Career Profile
Please introduce yourself. What is your current training/educational status and/or where do you work? How did you decide to get into scientific visualization?
I am currently a Staff Scientist at Harvard’s Wyss Institute for Biologically Inspired Engineering. At the Wyss, I spend part of my time producing biologically inspired art and entertainment and part of my time doing computational theoretical biology and design.
I got into visualization because I have always preferred theory and thinking about science conceptually over performing experiments in the lab. I have also always oscillated between art and science. For example, after I completed my undergraduate in medicinal chemistry I went on to art school and then worked in the film industry for a few years, before going back to science for my PhD. I think my choice in career path has also been strongly influenced by my networks outside of science. My closest friends have always been architects and designers, and have consistently challenged me to incorporate their tools and methodologies in my work.
What do you like the most about this field?
What I like most is the problem solving and real-time experimentation that is part of the everyday work. I come from a lab based research background where experiments often take place over weeks or months. It is therefore, very satisfying to be able to test ideas and know immediately whether or not the idea works.
How and where did you acquire your current skillset in scientific visualization? Was it all via a graduate or other program or are you self taught? If so, did you use any particular online resources to help with your training?
Mostly I am self-taught but over the years I have taken many weekend and evening courses through universities and online resources. In the beginning I used molecularmovies.com and digital tutors a lot. When I started using Houdini, python and Nuke more, I relied heavily on cmivfx.com and the various software providers own learning paths, which they all provide on their websites. Now I mostly use the help functions built into most software, deconstruct example files and consult forums such as odforce.For more scientific toolsets, such as R and Matlab, I tend to use Coursera, Kaggle and Datacamp. At the moment I am doing machine learning course through Stanford and a data science course through Johns Hopkins, on Coursera. For my molecular dynamics (MD) skillset, I attended a weeklong workshop at the University of Illinois at Urbana Champaign and now I continue to use the tutorials provided by Klaus Schulten’s Theoretical Biophysics group.
What do you consider some of the biggest barriers to entering the field? Are they technical, training, scientific, professional (availability of jobs or projects)?
The technical side, while difficult is also very rewarding, so for me this is not the barrier.
I think that the biggest challenge I have found is in finding appropriately ambitious projects and meaningful collaborations. I tend to be approached to do visualizations at the end of a project in order to demonstrate a discovery, however I believe that the real power of visualization and simulation is when it is part of the overall experimental design and data exploration process.
How do you feel your PhD training has an impact on your scientific visualization work? What specific skills from your PhD training have empowered you in your scientific visualization work? Do you think your PhD training has given you a unique perspective on viewing, interpreting, and creating scientific visualizations?
The process I use in my animation/visualization is very similar to the scientific process of hypothesis generation followed by experimentation; so good techniques learned in the lab are very applicable to my every day workflow. Habits that include documenting changes made, version control or simply running control experiments. These strategies make debugging a workflow or reverse engineering an effect much more straightforward.
I also think that if I were to go back to the lab now, after learning better habits through animation, I would make a better experimentalist.
There are also the more obvious benefits of doing a PhD or simply spending time in a research environment. Benefits such as being able to navigate scientific data and peer reviewed publications fluidly. Sometimes there is also the aspect of credibility with other scientists. I have often found that once somebody realizes I have a PhD and come from an experimental background, they interact slightly different with me and the collaboration happens more effectively.
I also believe my experience at the Melbourne Business School (marketing and new venture creation/entrepreneurship) helps me tremendously. Especially when it comes to establishing an agenda and interacting with people across disciplines.
Can you provide a specific example/situation of where you think your PhD training changed the way you designed something, interacted with someone or navigated a situation?
Many of my current projects involve simulations and data sets from both cellular and molecular resources. This involves navigating publications and existing data sets to build up an empirical understanding of the biological system I am designing. Data is very context dependent and you cant always trust what it “looks” like. Therefore, having an understanding of what the data represents and what context it is based in, guides the design approach and helps decisions around when to be precise and when to be “blurry”. What this means is that I can use knowledge around experimental uncertainty to have more creative freedom in the visualization. This has the added benefit of experimental hypothesis generation through the visualization design process.
A Specific example that I am currently working on is the simulation of sperm swimming using a finite element solver (that is based on semi quantitative experimental data) that then, through inverse kinematics, guides a template for flexible fitting molecular dynamics simulation of the dynein molecular engines that drive the swimming motion.
Which practitioners (or what visualizations) have been most inspirational to you?
I think that Donna Cox and her team as the University of Illinois do really inspiring work and they have down an amazing job at combining science with art and entertainment. I have also always enjoyed motion graphics and tend to get a lot of inspiration from things like title sequences, brand identities and commercials. One of my all-time motion graphic favorites is Daniel Sierra’s Oscillate.
Which conferences would you recommend to those interested in this field and why? What particular insights or benefits did you get out of attending this (these) conferences?
Vizbi has been a really good conference for me to meet with people in the field of biological visualization and I have always enjoyed the conversations I get to have there.SIGGRAPH is a really great conference to meet with people from outside of science and is a lot of fun.
If there was one resource, tool or conference that you could wish for to facilitate your work, what would it be?
A conference that covered data exploration, simulation, experimental-data integration and design in theoretical biology would be fantastic. Or a workshop focused on applying design thinking to biological problems, where we could look at a problem holistically and establish a design brief, then integrate current understanding into a dynamic model or set of priorities and hopefully “discover” with existing data sets.
What other advice would you offer those interested in either a professional or full-time academic career in scientific visualization?
Look far outside of your own field for inspiration and get advice from as many people as possible.
Please comment briefly on the samples/links that you have submitted for this profile… why in particular are you proud of these and what do you hope viewers will notice and get from seeing them?
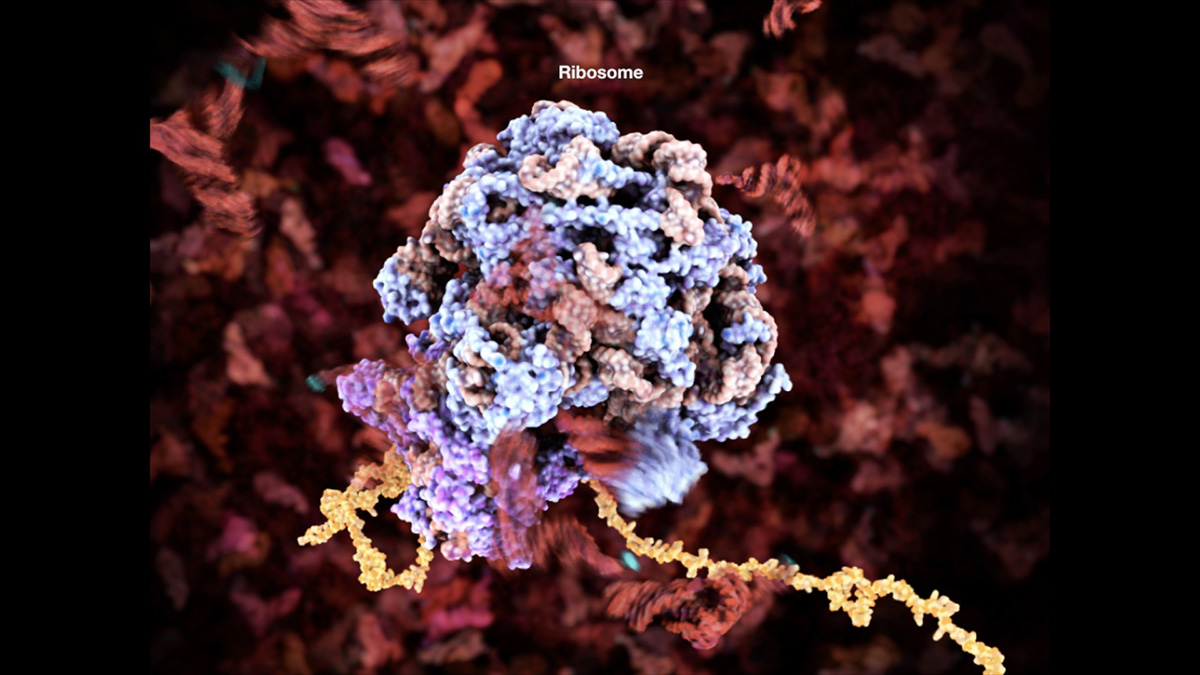
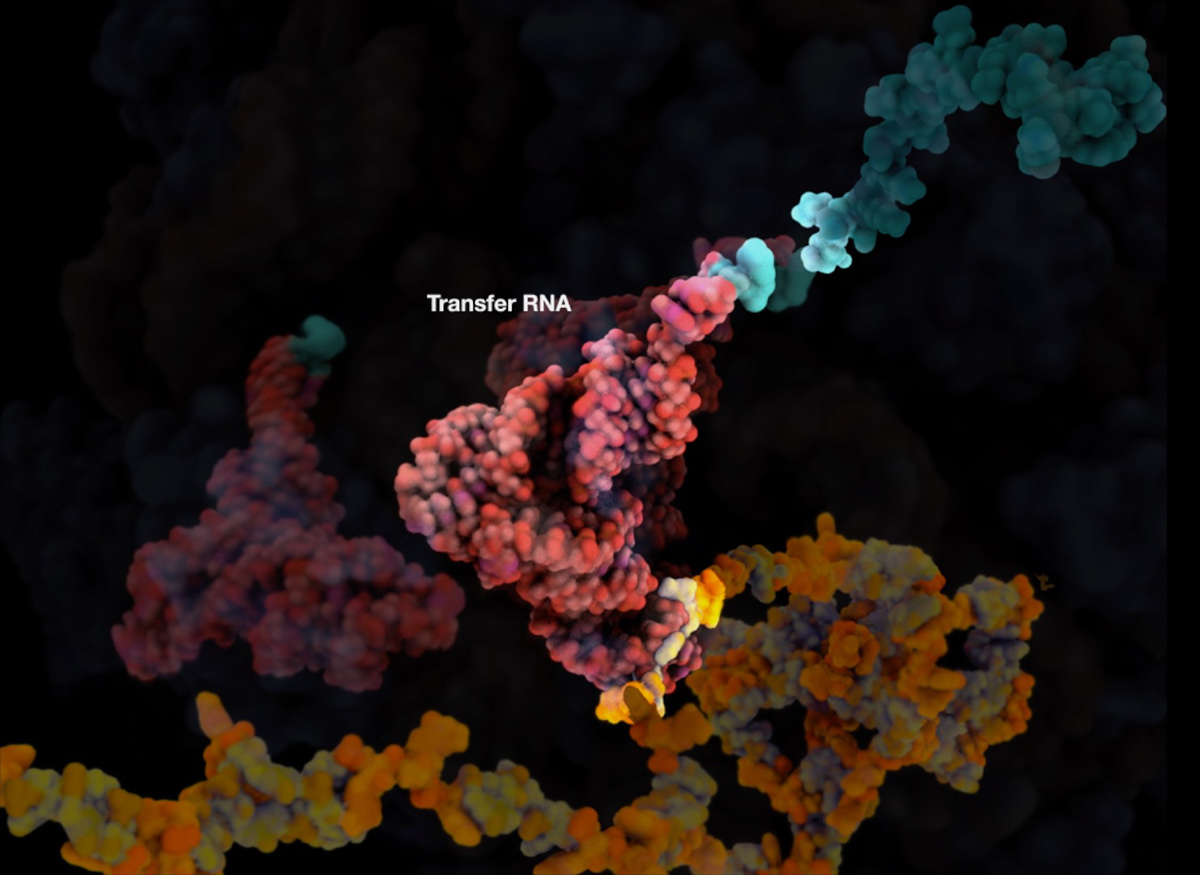
I am proud of the ribosome animation I did for E.O Wilson’s Life on Earth as it was the first time I really started to look at designing the visualization pipeline as a process and building assets before storyboards. It was pretty risky to change my approach as I hadn’t used Houdini or done much MD before this. Developing this approach also involved applying for a grant, which I was successful in getting and using to visit the University of Illinois to learn MD from the Schulten group.
By using an approach that incorporates simulated data, I hope that the viewer gets a better sense of the mechanics of the molecular world. In kind of the same way the entertainment industry uses motion capture data to overcome the effects of the “uncanny valley”, I hope that by using simulated data, viewers will have an opportunity to develop a better “molecular” intuition.
This particular animation was built using Cryo-EM and crystallography data to guide a Flexible Fitting MD simulation in order to achieve a ratcheting motion. The RNA and protein unfolding were also achieved using various MD simulation strategies and then Houdini was used for secondary simulation as well as a staging and rendering environment.
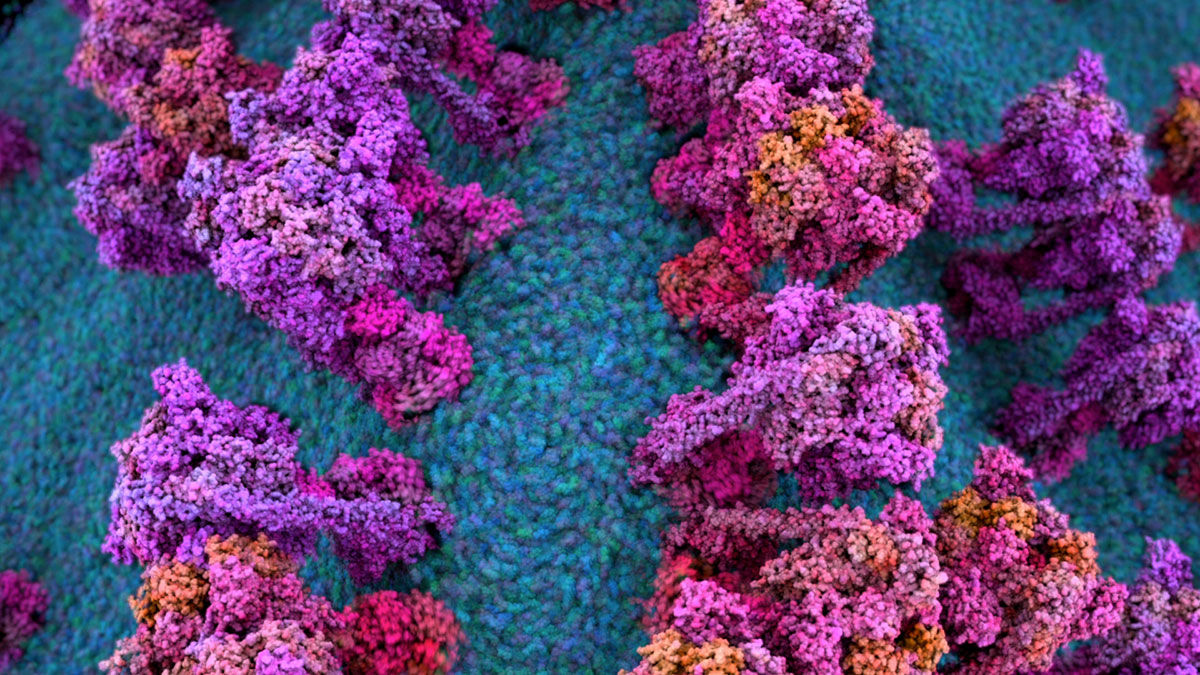
The second example (a forest of ATP synthase) is also from EO Wilson’s LOE and I am proud of this because it was the first time I really took advantage of Houdini and Nuke’s powerful procedural design capabilities to incorporate massive amounts of dynamic MD data through creative use of instancing, caching and rendering AOVs.
Where do you think the field scientific visualization is ‘going’? Do you perceive any trends in its evolution or are there certain directions that you would like to see implemented?
I think that visualization will play an important role in interdisciplinary research. It will likely facilitate closer integration of heterogeneous data types and close the gaps between simulation and experimentation. I think that this will be implemented through the inclusion of parametric and procedural visualization techniques in the scientific toolbox. I think that this inclusion will further enable “design” based approaches to scientific questions, especially in the realm of exploring multidimensional data.
And then lets end with a simple question… What is your ‘10 year plan’ in terms of what you hope to accomplish in scientific visualization?
I hope to establish an organization/entity (not necessarily visualization) that seeks to further scientific understanding through an artistic agenda. An entity, either academic or commercial, that sits at the crossroads of simulation, data exploration/integration, communication, entertainment, design and theory. Ultimately this entity would work on what I am starting to refer to as “procedural biology”.