
Academic /
Scientific Animator
Career Profile
Please introduce yourself (what is your current training/educational status and/or where do you work?) and share with us how you decided to get into scientific visualization.
I studied physics and did my PhD in life sciences in Leiden (the Netherlands). Currently, I am staff scientist at an institute in Berlin (Germany) with the focus on molecular pharmacology, where I do research in structural biology of proteins using NMR techniques. Many diseases can be directly linked to proteins that don’t behave the way they should, and this is exactly what we try to figure out.
As a scientist I always like to (or at least, I try to) explain difficult topics in a pictorial way. At some point I got fascinated by the beautiful scientific visualizations originating from collaborative work of scientists and artists. I realized that this could offer a great opportunity for me to combine science with artistic creativity, to do research as a scientist in molecular biology and at the same time visualize the science that is being researched.
What do you like the most about this field?
The sheer endless possibilities to combine scientific storytelling with visuals in a language everyone can understand. And the instant satisfaction this often provides in form of positive feedback! Apart from that, I like the challenge involved in the process of translating science into a visual story, thinking of how to clearly communicate what is based on facts and what is science-fiction. How closely does one have to stick to scientific correctness and how much artistic freedom can one afford? Decisions on a proper balance between art and science depend very much on the audience that is going to watch an animation or see the illustration, which can range anywhere from fellow scientists to school kids. In the end, it is the audience that has a strong impact on the chosen style and where the work will land within the triangle with ‘Science’, ‘Fiction’ and ‘Art’ at the three corners.
How and where did you acquire your current skillset in scientific visualization? Was it all via a graduate or other program or are you self taught? If so, did you use any particular online resources to help with your training?
I didn’t receive any formal education in scientific drawing or visualization. All skills for scientific illustrations and animations are self-taught, so basically I learned by doing, experimenting and following online tutorials. There are many resources for learning on the web, both free and commercial, though unfortunately there are not that many fully dedicated to scientific visualization, such as Clarafi.com. On the other hand, this is may not really be a problem as long as you are creative and are able to think a bit out-of-the-box! For example, if I watch a tutorial on how to populate a landscape with thousands of trees, my first thought would be “Great, so this is the trick how to scatter lipids on a cell membrane!”
How do you feel your PhD training has an impact on your scientific visualization work? What specific skills from your PhD training have empowered you in your scientific visualization work? Do you think your PhD training has given you a unique perspective on viewing, interpreting, and creating scientific visualizations?
I think my PhD training had quite some impact. Being a scientist, it is easier to translate the research into a picture or animation that tells the same story in a creative way but with the right amount of scientific ‘correctness’, and for this process it is very important to understand the science behind. I can read and understand the corresponding publication and I am able to play with ideas, both artistically and scientifically. As a scientist I can trigger ideas that the artist might not have been able to think of, and vice versa. This really makes a difference in the communication between the scientist and the artist. Ideas in the scientific visualization process come up more naturally when the artist exactly understands what the scientist wants to express.
Can you provide a specific example/situation of where you think your PhD training changed the way you designed something, interacted with someone or navigated a situation?
I would rather give an example of the opposite here, of a situation where the scientific visualization interacted with our scientific work. We have been doing research on a protein that auto-transports through the cell membrane, by forming a barrel through which it transfers itself as a long coiled-coil construct (imagine this transport as a sock that is being flipped inside-out). I have been trying to visualize this process and almost naturally came to the conclusion that things get horribly entangled unless the coiled-coil changes its helical direction halfway. Interestingly, our collaborators independently came to exactly the same conclusion, but from scientific experiments.
What do you consider some of the biggest barriers to entering the field? Are they technical, training, scientific, professional (availability of jobs or projects)?
If you are completely new to computer generated graphics and animations, the biggest barrier you will be confronted with is the steep learning curve and complexity of the software which can be truly daunting for a newcomer; just take a look at the seemingly endless list of credits at the end of a Pixar movie, with all these people each contributing a small but essential part – like modeling, texturing, rigging, animating, lighting, rendering, special effects, etc. As a scientific illustrator you are often not part of a big team, which means that you will have to learn and master all these different steps or techniques by yourself. And this can take years!
Which practitioners (or what visualizations) have been most inspirational to you?
I totally admire the work of David Goodsell, the passion and devotion that emanate from his images is simply infectious. I would love to see a first ‘animated’ Goodsell-style visualization! Another person that motivated me along the way is Gaël McGill. I first met him at the Vizbi 2012 in Heidelberg where he did a one-day Maya tutorial. In retrospect, he is the one that really “got me” into Maya. I showed him some of my early creations with Maya when we met again half a year later at a conference in Copenhagen (Denmark). I remember I was a bit shy and afraid for his “verdict”, but he gave me a very honest and positive feedback! This really meant a lot to me.
Which conferences would you recommend to those interested in this field and why? What particular insights or benefits did you get out of attending this (these) conferences?
I think the Vizbi is a very good one as a start; it is a great opportunity to get into contact with many people in the field. The insight I took home? That scientific visualization embraces so much more than just making cool animations with wobbling proteins!
What other advice would you offer those interested in either a professional or full-time academic career in scientific visualization?
Learn the software and be passionate about that. Follow online tutorials in your spare time, learn the tools and tricks from the professionals, and always keep an eye open for alternative uses of the techniques you just learned – they might not seem to be directly related to the goal of scientific visualization that you try to pursue, but they are. Tutorials supply you with the necessary tools you need – there is nothing more frustrating than exactly knowing what you want to do but not knowing how!
Please comment briefly on the samples/links that you have submitted for this profile… why in particular are you proud of these and what do you hope viewers will notice and get from seeing them?
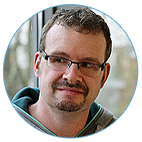
Sample 1: Cover Illustration for Chemical Science
I like this figure very much because it is very narrative. I have taken various elements from the corresponding paper out of their scientific context and combined them with real-life elements as various metaphors into a sort of scientific still-life. The paper was about biosensors, contrast agents for xenon MRI. An integral part is a molecular host that traps the xenon. The old host (with slow xenon exchange) is the cryptophane-A cage, in the figure displayed as a bird cage covered with spider webs that traps an unhappy xenon atom. The new host (with fast xenon exchange) is cucurbituril, a molecule named after its pumpkin-like shape (pumpkins belong to the botanical family of ‘cucurbita’). Since the work was to be published around Halloween, the idea to make a connection between the scientific work, a pumpkin and Halloween almost naturally arose.
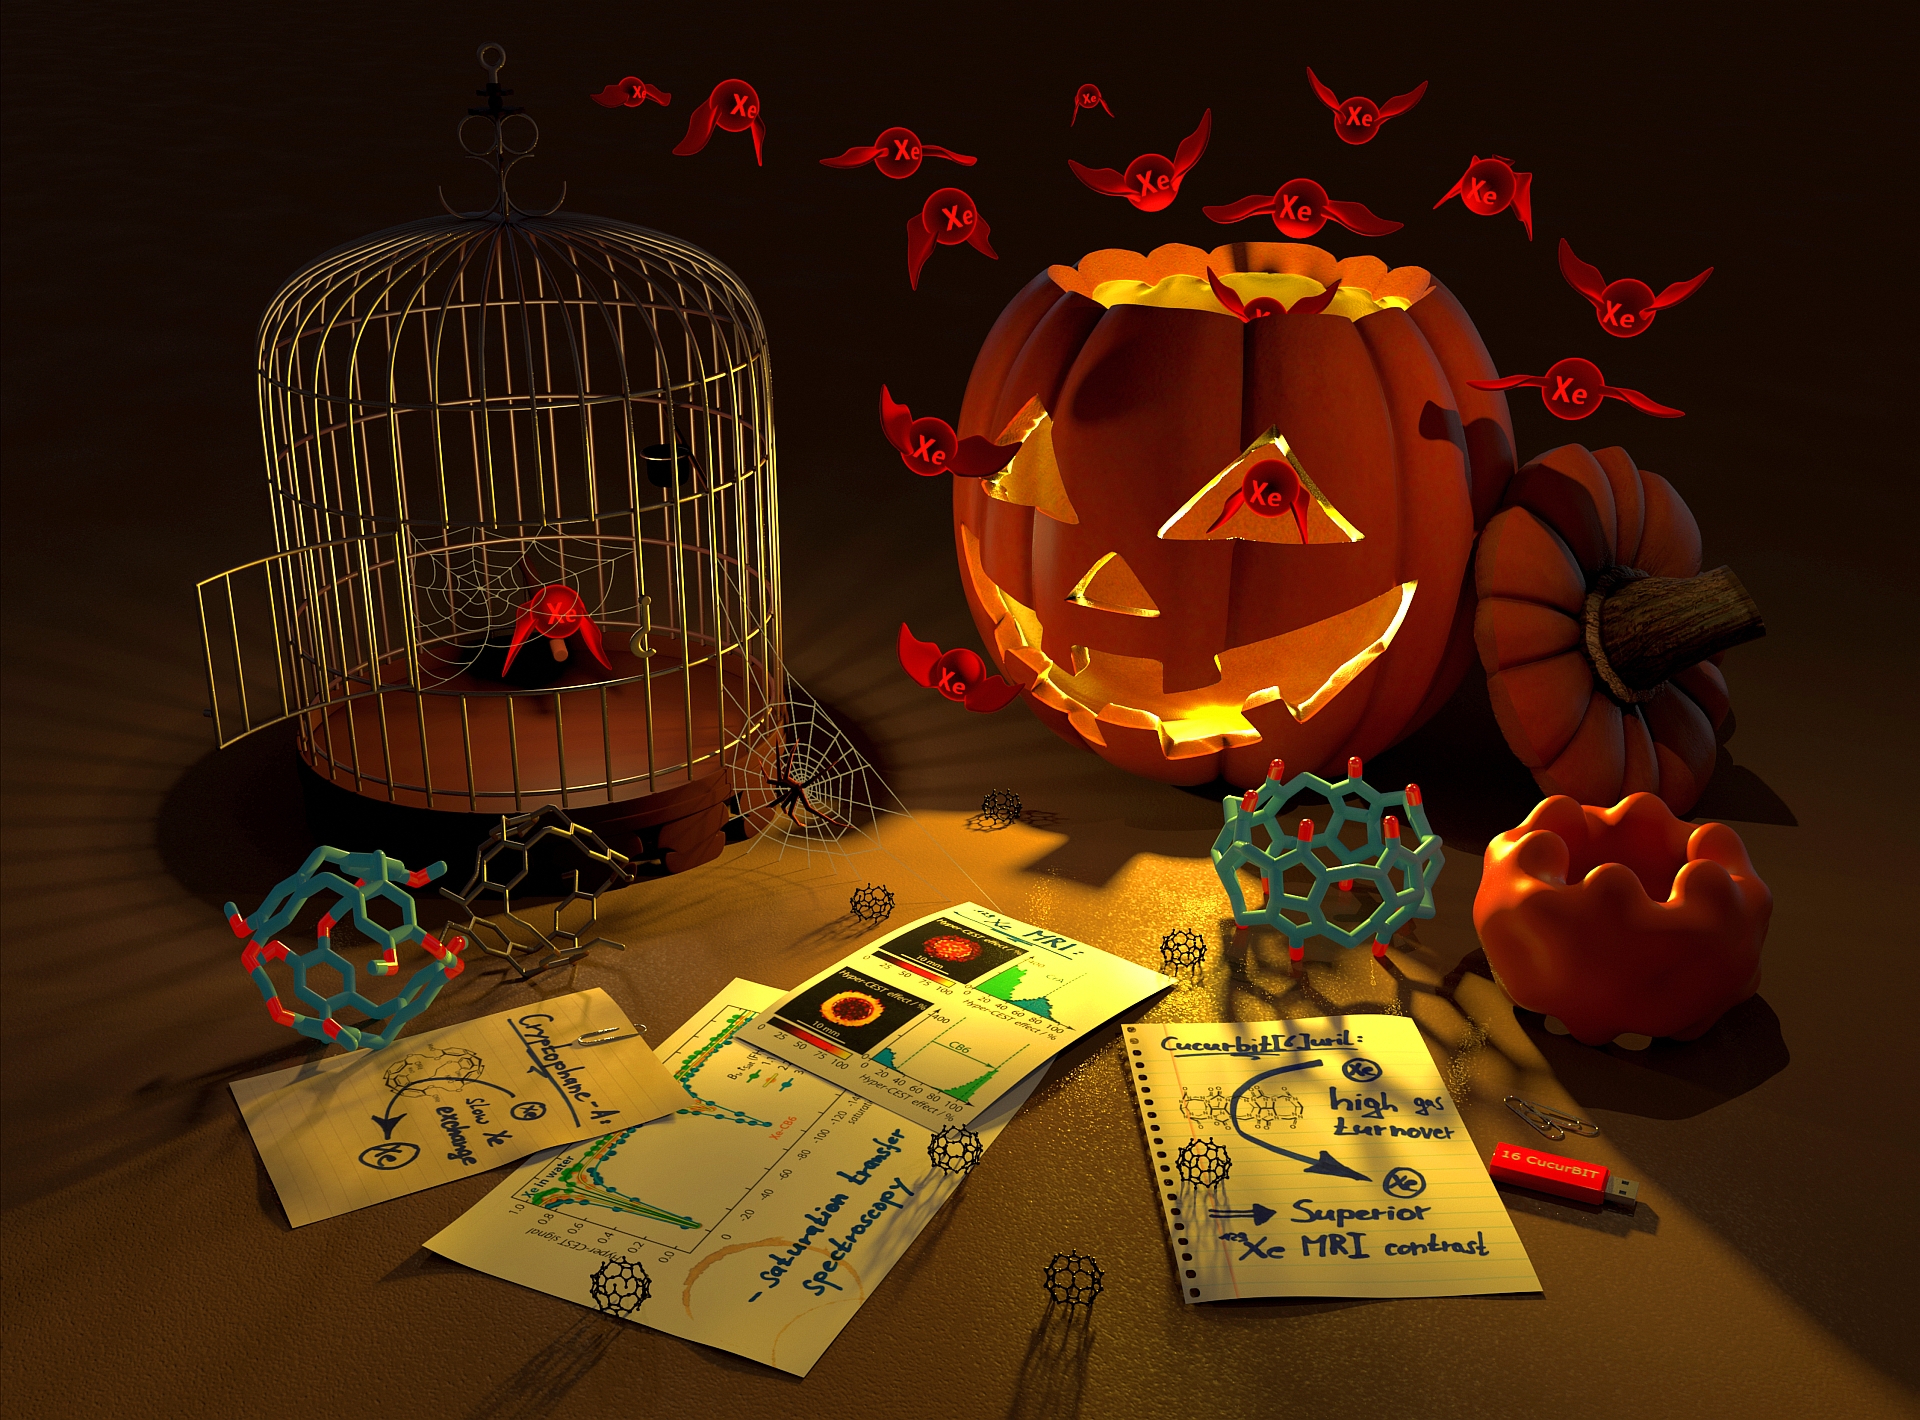
Sample 2: Bacterial Surface Covered with Adhesins
This figure won the second price in a scientific image contest. It is an ‘artist impression’ of a bacterial surface covered with adhesins, sticky lollipop-like proteins that play a role in bacterial infection. It was never meant to be a serious picture: I made it as a little side-track while I was working (and got fed up) on a far more elaborate figure of the same protein. It took me only about two/three hours from start to finish, and ironically this was the figure that people liked very much, more than the other elaborate one…
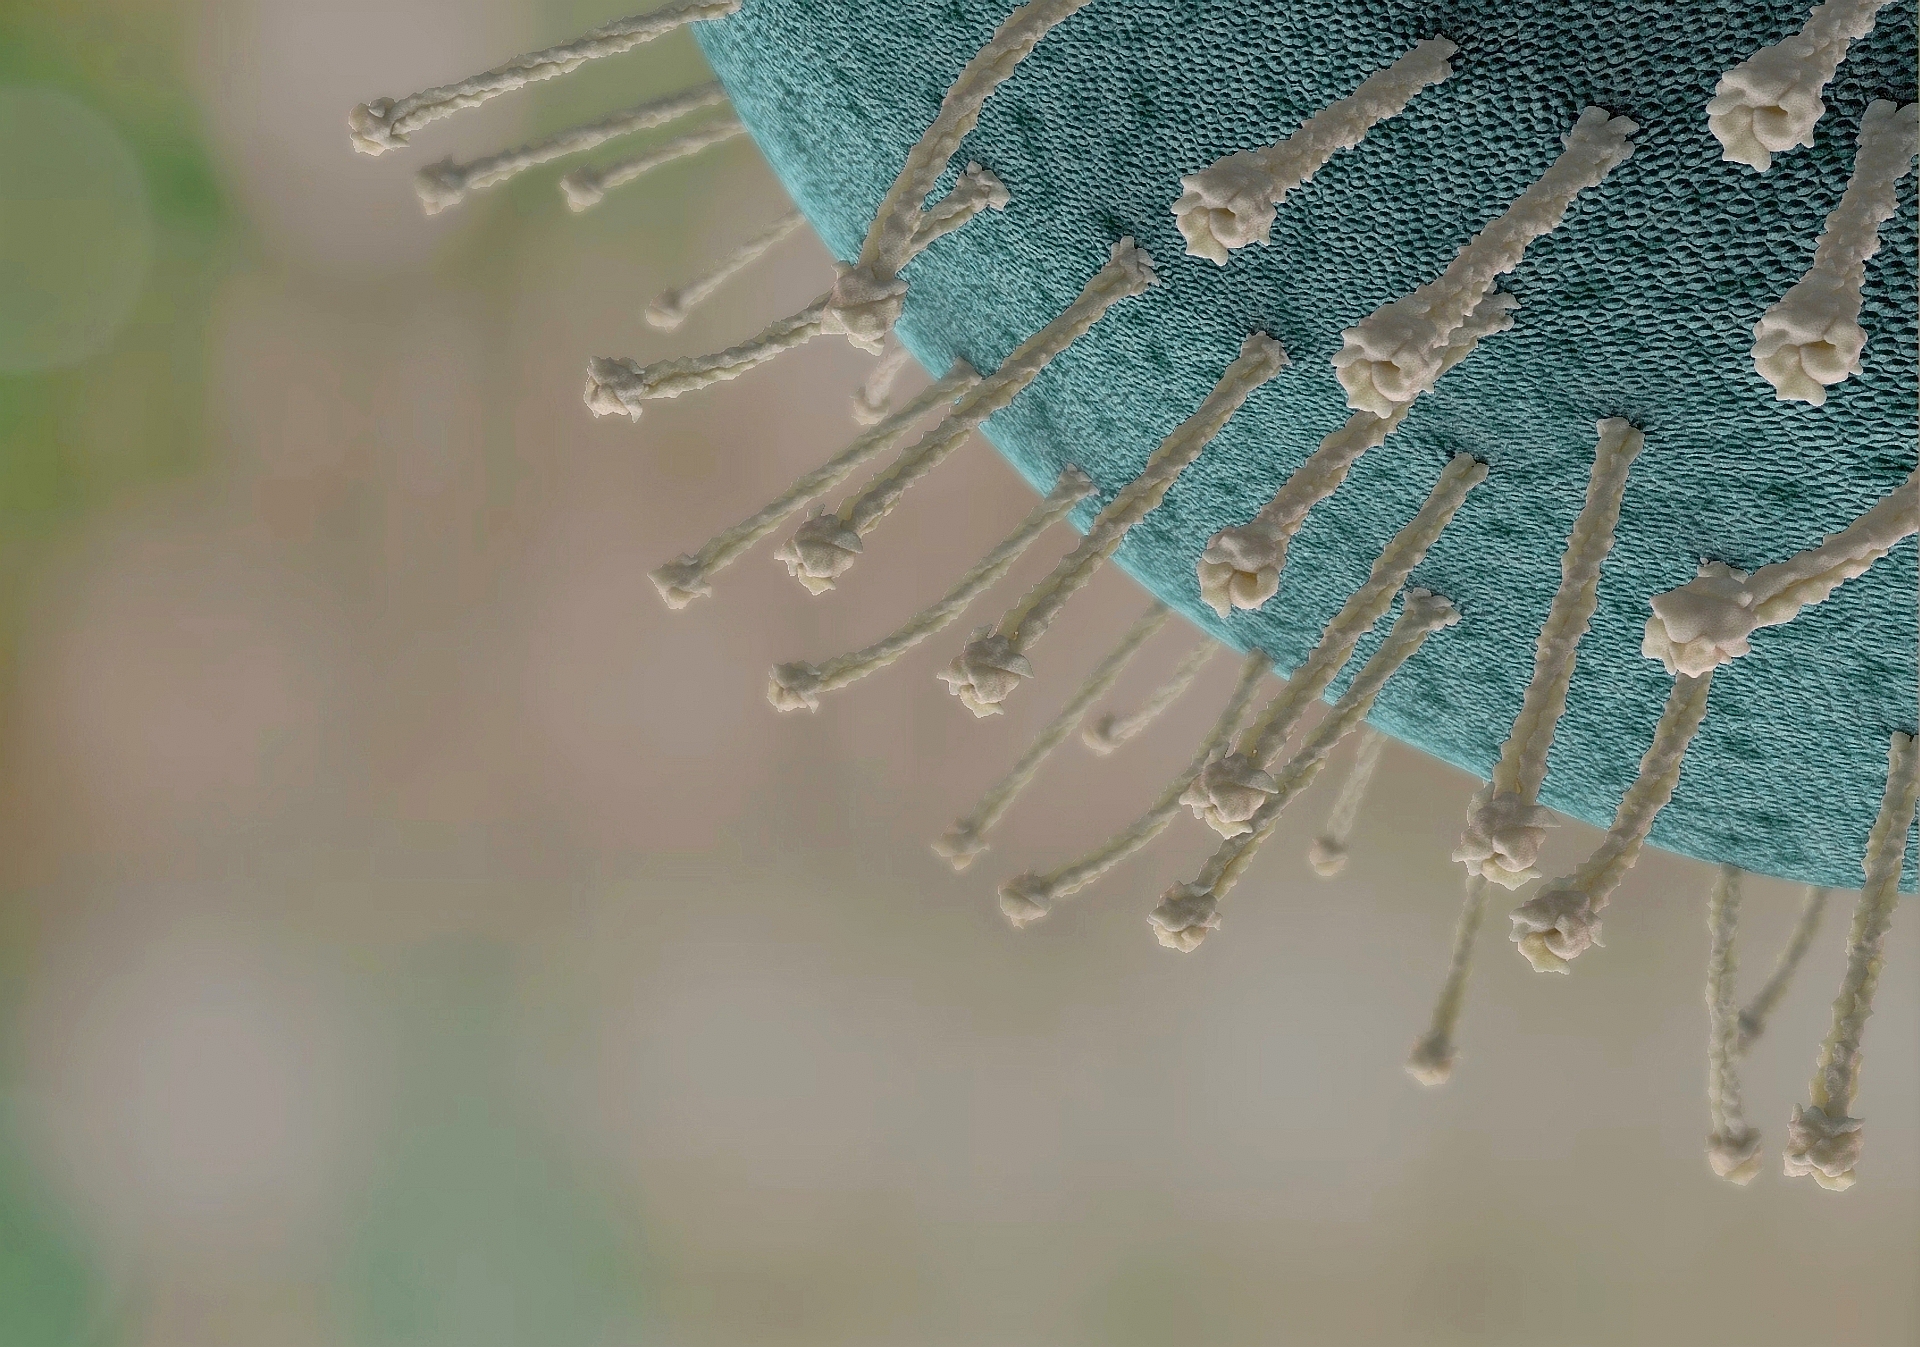
Sample 3: Cellular Compartments
This figure was part of a grant proposal and was used to guide the reader to the various cellular compartments that the proposal was about. I personally am very satisfied with the schematic ‘rubbery’ look of it – and that it contains some Easter eggs (which I am not going to tell!)